Mayo LBNP hypovolemia: non-invasive biomarkers during lower body negative pressure
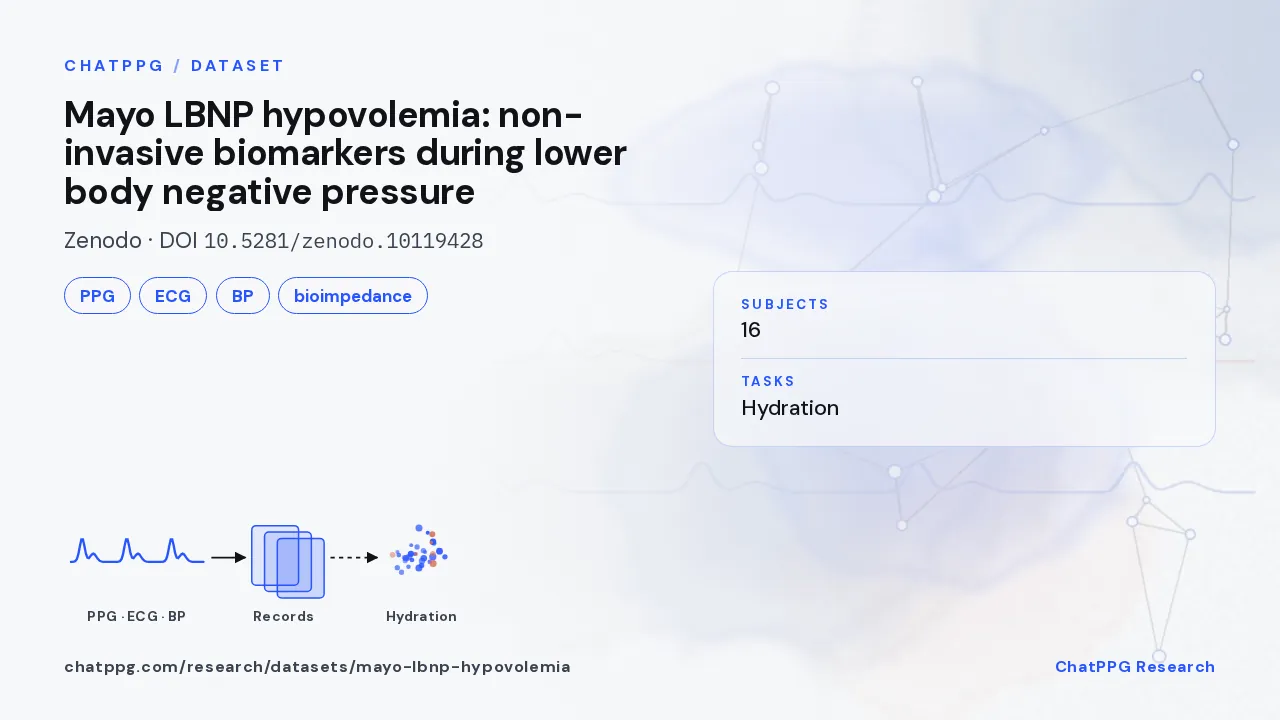
This is the raw data behind a study of non-invasive biomarkers for detecting progression toward hypovolemic cardiovascular instability in a lower body negative pressure model. It covers 16 subjects with ECG, mean arterial pressure and pleth (PPG) recordings, plus electrical impedance and bioimpedance cardiography data.
- Published: Zenodo, 2023
- Cohort: 16 subjects
- Model: lower body negative pressure (simulated hypovolemia)
- License: CC BY 4.0
- Type
- Dataset
- Access
- Not reported
- Subjects
- 16
- Signals
- PPGECGbpbioimpedance
- PPG sites
- Not reported
- Setting
- Not reported
- Wrist
- No
- Raw waveforms
- Yes
- Tasks
- Hydration
- Updated
- Oct 15, 2026
Original description
Raw data associated with the study entitled "Non-Invasive Biomarkers for Detecting Progression Toward Hypovolemic Cardiovascular Instability In A Lower Body Negative Pressure Model". There were 16 subjects with 1. electrocardiogram (ECG), 2. mean arterial pressure (MAP), 3) photoplethysmography (pleth), 4) Bioimpedance Cardiography measured via a Cheetah (Startling/Medtronic) system referred to as cheetah, 5) electrical impedance from a Sentec electrical impedance tomography system, referred to as ST, and electrical impedance from a sciospec impedance analyzer, referred to as SS. Each subject underwent a lower body negative pressure (LBNP) procedure, where the LBNP was increased modeling a small hemorrhage by drawing blood to their lower extremeties. The dataset contains 5 mat (MATLAB data files), with time reported in minutes on the day of the study, i.e.10 am = 600 minutes. The file details are as follows:
LBNP data: LBNP_level_times.mat. The data contains 1 structure (LBNPinf) of length 16 (corresponding to each subject) with the following fields
ts: time vector in minutes lbnp: LBNP value at each noted time Vital Sign data: raw_labchart_data.mat. The data contains 1 structure array (Labchart) of length 16 (corresponding to each subject) with the following fields
ts: time vector in minutes ecgs: ECG data MAP: MAP data pleth: pleth data recorded from a single channel (V) Sentec EIT data: raw_av_ST_impedance_data.mat. The data contains 1 structure array (STout) of length 16 (corresponding to each subject) with the following fields
t_thx: time vector in minutes corresponding to thorax data Z_thx: average impedance data at each time over the thorax t_spl: time vector in minutes corresponding to abdomen data Z_spl: average impedance data at each time over the abdomen Sciospec EIS data: raw_sciospec_dat.mat. The data contains 1 cell array & 1 structure array (sciodat) of length 16 (corresponding to each subject).
Cell array: Locations of the Sciospec measurements: 'Thoracic', 'Abdominal', 'Arm' Sciodat fields:
sciodat structure array of length 3 corresponding to the 'Thoracic', 'Abdominal', 'Arm' locations, respectively. Each component has the following fields
tvec: time vector in minutes fs: frequencies that the impedance is recorded over (Hz) Zmat: matrix of impedance data size time versus frequency erflg: not used Bioimpedance cardiography data: raw_cheetah_bioimpedance.mat. The data contains a cell array of column labels (col_labs, 1x11) and a matrix (cheetah_db) of the BC data.
Verbatim fromDataCite· Licence: https://creativecommons.org/licenses/by/4.0/legalcode
Key numbers
How it works
No model in the hub reports results on this dataset yet.
- Reference labels
- hypovolemia, lbnp level, wearable fm, dataset, hypovolemia, lbnp, hydration, zenodo, cc by
- Device roles
- Clinical reference (BP)
Models trained or evaluated on it
Cite
@misc{mayolbnphypovolemia2026,
  title = {{Mayo LBNP hypovolemia: non-invasive biomarkers during lower body negative pressure}},
  year = {2026},
  howpublished = {Zenodo},
  doi = {10.5281/zenodo.10119428},
  url = {https://doi.org/10.5281/zenodo.10119428}
}History
Record updated