Learn PPG
Skewness as a PPG Signal Quality Index
Skewness summarizes whether the samples in a PPG window lean to one side of their mean. On one annotated fingertip set, that single number separated excellent, acceptable, and unfit recordings better than perfusion, kurtosis, entropy, and four other indexes. The annotators only moderately agreed, and the set was healthy people at rest.
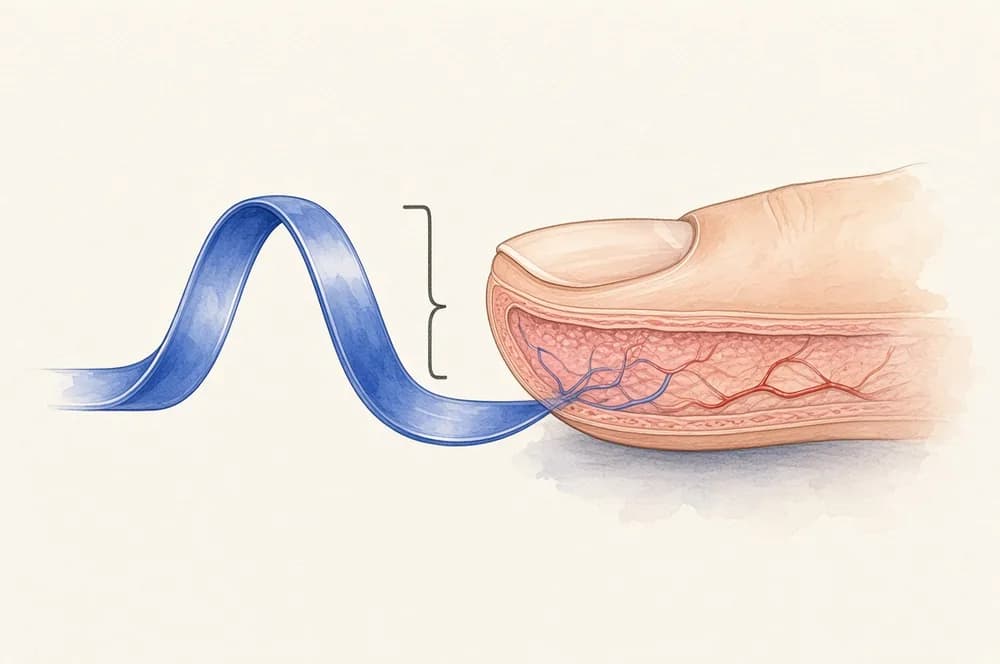
What skewness is doing on a pulse
Skewness is the standardized third moment of a set of samples. Elgendi describes it as a measure of symmetry, or of the lack of it (Elgendi 2016). A pulse with a steep rise and a long fall is not a symmetric hump, so the samples are not arranged like a bell. A stretch of motion that looks like wandering noise is closer to symmetric. That is the intuition. It is not a guarantee that every clean pulse has a published numeric range you can paste into firmware.
Krishnan and colleagues had already tied higher-order statistics to corrupted PPG. Elgendi cites that work and then runs the head-to-head that was missing: eight indexes, the same labels, the same windows.
The other seven were perfusion, kurtosis, relative power, non-stationarity, zero crossings, entropy, and agreement between systolic-wave detectors. Perfusion is the ratio of the pulsatile part to the steady part, the same idea as the perfusion index. Elgendi calls perfusion the reference several oximeter makers were using (Philips, Nellcor-Medtronic, Masimo). Kurtosis and Shannon entropy had also been tried as PPG quality indexes. He wanted one simple index, not a stack of them.
What the 2016 comparison measured
The traces came from a heat-stress study of 40 healthy emergency responders (30 men, 10 women, mean age 34.7 ± 6.6 years). They worked in impermeable protective equipment in tropical conditions, then sat. A fingertip sensor (Salus APG, 367 Hz, cuticle of the left second digit) recorded 20 seconds at rest, including before exercise and after each bout. The paper describes the group as normotensive (mean systolic pressure 129.3 mmHg, range 110–165) with no known cardiovascular, neurological, or respiratory disease.
For the quality test, three 20-second traces from different time points were stitched into a 60-second recording, and the stitch was repeated so the analysis set held 106 recordings. The stitch mixed morphologies on purpose. It is not a continuous minute from one person.
Two annotators labeled each 60-second recording by the dominant beat: excellent when systolic and diastolic waves were salient, acceptable when those waves were not salient but heart rate could still be determined, unfit when heart rate could not be determined and the waves could not be told apart. They agreed on 70 recordings (66.04%). Chance agreement was about 37 recordings (34.93%). Cohen's kappa was 0.48, which the paper calls moderate. A third expert adjudicated the disagreements. The adjudicated counts were 36 excellent, 52 acceptable, and 18 unfit.
The first annotator's counts had been 44, 21, and 41. The second's were 33, 26, and 47. Those gaps are the result, as much as the F1 scores. A "ground truth" for PPG quality was already soft.
Where skewness won, and the cut he could draw
Indexes were compared with Mahalanobis distance, linear and quadratic discriminant analysis, and a support vector machine, with leave-one-out cross-validation. Skewness outperformed the other seven at separating excellent recordings from acceptable ones, from acceptable-plus-unfit, and from unfit alone. The abstract gives the F1 scores as 86.0%, 87.2%, and 79.1%.
On the linear split of the adjudicated labels, sensitivity and positive predictivity were 82.69% and 89.58% for excellent versus acceptable, 82.86% and 92.06% for excellent versus the other two classes combined, and 94.44% and 68% for excellent versus unfit. He could draw the skewness threshold at zero. He could not draw one fixed threshold on the perfusion index for the same plots.
Window length was tuned. A 2-second window was enough, on this set, to separate an excellent recording from an unfit one. Separating excellent from the mixed lower classes wanted a longer window. The paper's aim was a decision about a minute of signal, not a label on every beat. He notes that beat-by-beat annotation would have been the ideal and that it was too slow for this study.
The conclusion's wording is careful about what "optimal" means. On this heat-stress fingertip set, skewness was the best single index of the eight. He writes that more skewness went with a more detailed pulse shape, and that the index could potentially help later screening. The experiment did not classify hypertension. The participants were studied at rest, after heat and exercise, and arrhythmia was not in the file.
What not to export unchanged
A zero threshold and a 2-second window are results on stitched fingertip traces from healthy adults. Elgendi lists the limits himself. A larger set that includes unhealthy subjects would test whether the ranking holds. Arrhythmia changes beat shape, so a skewness rule tuned on sinus pulses can flag the rhythm as poor quality. There was, in his account, no mobile PPG database of hypotension, hypertension, or flutter to try. Annotators disagreed moderately, so a deployed cut is also a choice about whose labels count.
Wrist wearables add motion that this seated protocol only partly resembles. Charlton's later wrist study found posture and sensor height moving signal-to-noise ratio, template correlation, and perfusion together (Charlton 2025). That paper does not rerun Elgendi's eight-way horse race. Skewness can still be computed on a wrist window. Whether it remains the best single index there is a different study.
vital_sqi exposes skewness as one of its standard statistical indexes, with the accept/reject rule left to the user. That packaging is described on the tools page. Combining skewness with other indexes was Elgendi's stated next step, not the result of the 2016 paper.
The signal quality index guide holds the wider map. The implementation article is the place for a processing pipeline. This page is educational. It is not a clinical threshold and not a diagnosis.
Research on this site
These records are public datasets, models, and papers linked from this guide.
- Optimal Signal Quality Index for Photoplethysmogram SignalsSkewness beat seven other indexes on one fingertip setBioengineering · 2016
 Lightweight ResNet-Based Deep Learning for Photoplethysmography Signal Quality AssessmentA learned classifier, for comparison with a single statisticarXiv preprint · 2025
Go deeper
Frequently Asked Questions
What is a skewness SQI?
A signal quality index that uses the skewness of PPG samples in a window. Elgendi (2016) found it the best of eight indexes at separating excellent, acceptable, and unfit fingertip recordings, with F1 scores of 86.0%, 87.2%, and 79.1%.
Did annotators agree on which pulses were excellent?
Moderately. They agreed on 70 of 106 recordings (66.04%). Cohen's kappa was 0.48. Adjudication left 36 excellent, 52 acceptable, and 18 unfit.
Is a skewness of zero the cut-off I should ship?
It is the fixed threshold Elgendi could draw on that one dataset's linear plots. The recordings were stitched 60-second fingertip traces from healthy adults at rest. He writes that arrhythmia and a larger, less healthy sample are untested.
How is skewness different from the perfusion index?
Perfusion compares pulsatile amplitude with the baseline. Skewness describes the asymmetry of the sample distribution. On Elgendi's set, perfusion was the comparison 'gold standard' and skewness scored higher. A low perfusion index can be poor contact or a small pulse.