PPG vs ECG Accuracy Comparison: Heart Rate, HRV, and Arrhythmia Detection Data
PPG vs ECG accuracy compared for heart rate, HRV metrics, arrhythmia detection, and respiratory rate with published validation data and comparison tables.
For resting heart rate and short-term HRV metrics like RMSSD, wrist PPG can match ECG within clinically acceptable limits, typically within 2-5 BPM for heart rate and within 5-10% for RMSSD under controlled conditions. For arrhythmia detection, specifically atrial fibrillation, algorithm-driven PPG achieves sensitivity around 93-98% and specificity around 90-97% compared to ECG reference. However, PPG cannot replace ECG for diagnosing specific rhythm disorders, ischemia, conduction abnormalities, or precise P-wave morphology. The accuracy gap between PPG and ECG grows substantially during exercise, in the presence of motion artifacts, and in patients with irregular rhythms. This page presents published validation numbers side by side for each measurement domain.
Heart Rate Accuracy: PPG vs ECG
Heart rate is where PPG performs best relative to ECG. Both methods count cardiac cycles, though PPG measures the mechanical pulse while ECG measures electrical activation. The difference between R-R intervals from ECG and pulse-pulse intervals from PPG is typically small at rest.
Resting Heart Rate
At rest, wrist PPG consistently achieves mean absolute errors (MAE) below 3 BPM against simultaneous ECG in validation studies. Finger and earlobe PPG typically perform better, with MAE under 1.5 BPM.
| Device / Method | MAE vs ECG (BPM) | Conditions | Source |
|---|---|---|---|
| Wrist PPG (Apple Watch S4) | 1.8 BPM | Seated rest | Spaccarotella et al., 2020 |
| Finger pulse oximeter | 0.9 BPM | Seated rest | Jubran, 2015 |
| Wrist PPG (Fitbit Charge 2) | 2.1 BPM | Seated rest | Dooley et al., 2017 |
| Earlobe PPG | 0.8 BPM | Supine rest | Kim et al., 2018 |
| Camera-based rPPG (face) | 3.2 BPM | Seated, controlled lighting | Verkruysse et al., 2008 |
These numbers look reassuring. For most clinical applications involving resting heart rate screening, the agreement is good enough to substitute PPG for ECG. The IEEE standard for wearable heart rate monitors (IEEE 80601-2-61) requires MAE below 5 BPM, and most modern devices comfortably meet this.
Heart Rate During Exercise
During exercise, PPG accuracy degrades because motion artifacts contaminate the optical signal. Wrist PPG is particularly affected because wrist tendons and muscles generate substantial mechanical noise at frequencies that overlap with cardiac frequencies.
| Device / Method | MAE vs ECG (BPM) | Exercise Type | Source |
|---|---|---|---|
| Apple Watch Series 3 | 4.6 BPM | Treadmill running | Shcherbina et al., 2017 |
| Fitbit Surge | 7.1 BPM | HIIT exercise | Stahl et al., 2016 |
| Polar A370 (wrist) | 3.9 BPM | Cycling | Gillinov et al., 2017 |
| Chest strap PPG | 1.7 BPM | Treadmill running | Van Gent et al., 2019 |
| Earlobe PPG | 2.3 BPM | Treadmill running | Böhm et al., 2019 |
The jump from sub-2 BPM at rest to 5-7 BPM during exercise matters if you are using heart rate to guide training intensity zones, which are typically 5-10 BPM wide. Measurement site makes a large difference: chest and earlobe placements reduce motion artifact and maintain accuracy closer to resting performance.
For more detail on what drives wrist PPG errors during movement, see our PPG heart rate accuracy analysis.
HRV Accuracy: PPG vs ECG
HRV analysis is where the PPG vs ECG comparison becomes more complicated. HRV metrics are calculated from the timing of individual beats, so any error in beat detection or timing shifts the resulting metrics. The pulse arrival time delay (the time between ECG R-peak and PPG pulse peak, typically 200-400 ms) introduces a systematic bias that affects some HRV metrics more than others.
Time-Domain HRV Metrics
RMSSD (root mean square of successive differences) is a widely used short-term HRV index. Because it measures differences between consecutive intervals rather than absolute timing, the constant portion of pulse arrival time cancels out. What matters is whether that delay is stable beat-to-beat. At rest in healthy subjects, it is reasonably stable.
| HRV Metric | PPG vs ECG Agreement | Conditions | Source |
|---|---|---|---|
| RMSSD | r = 0.98, bias = 1.2 ms | 5-min seated rest | Hernando et al., 2018 |
| RMSSD | r = 0.96, bias = 3.8 ms | Sleep | de Zambotti et al., 2019 |
| SDNN | r = 0.94, bias = 2.1 ms | 5-min seated rest | Hernando et al., 2018 |
| pNN50 | r = 0.91 | 5-min seated rest | Hernando et al., 2018 |
| Mean RR | r = 0.999, bias = 290 ms | Seated rest | Selvaraj et al., 2008 |
The high correlation for mean RR reflects the stable pulse arrival time offset. RMSSD and SDNN show strong agreement in resting conditions. The pNN50 correlation drops slightly because it counts intervals exceeding a 50 ms threshold, making it sensitive to small absolute timing errors.
Frequency-Domain HRV Metrics
LF (0.04-0.15 Hz) and HF (0.15-0.40 Hz) power are calculated from the power spectral density of the RR interval series. These are more sensitive to signal artifacts and noise than time-domain metrics.
| HRV Metric | PPG vs ECG Agreement | Conditions | Source |
|---|---|---|---|
| LF power | r = 0.89 | Supine rest | Selvaraj et al., 2008 |
| HF power | r = 0.92 | Supine rest | Selvaraj et al., 2008 |
| LF/HF ratio | r = 0.85 | Supine rest | Selvaraj et al., 2008 |
| HF power | r = 0.71 | Light activity | Schäfer & Vagedes, 2013 |
The frequency-domain metrics show more variability in agreement, especially LF/HF ratio. This metric requires accurate separation of two closely spaced frequency bands, and any interpolation artifacts or missed beats from PPG shift power between them. The agreement also drops during activity, consistent with the pattern seen for heart rate.
HRV During Physical Activity
HRV from PPG during exercise is substantially less reliable. Beat detection errors increase, and the pulse-to-pulse interval variability from non-cardiac sources (motion-induced changes in blood pressure and peripheral vascular tone) adds noise that does not correspond to cardiac autonomic variation.
Most published validation studies recommend against using wrist PPG for HRV measurement during or immediately after vigorous exercise. A 5-10 minute recovery period after exercise returns agreement to near-resting levels.
For a deep look at how motion artifacts specifically corrupt PPG-derived HRV, see our PPG HRV motion artifact accuracy analysis.
Arrhythmia Detection: PPG vs ECG
Arrhythmia detection is where the comparison shifts most sharply against PPG. ECG directly observes electrical waveform morphology, which is essential for classifying most arrhythmias. PPG sees only the mechanical output of those electrical events. However, one arrhythmia stands out as well-suited to PPG detection: atrial fibrillation.
Atrial Fibrillation Detection
AFib causes a chaotic, irregularly irregular pulse rhythm. This irregularity is visible in PPG-derived pulse interval sequences, even without seeing the underlying P-wave absence or fibrillatory baseline. Multiple algorithms have been validated for PPG-based AFib detection.
| Study | Device | Sensitivity | Specificity | Population |
|---|---|---|---|---|
| Tison et al., 2018 | Apple Watch (passive) | 98.5% | 90.2% | 9,750 participants |
| Bumgarner et al., 2018 | AliveCor KardiaBand | 93.0% | 84.0% | 100 patients |
| Lau et al., 2020 | Fitbit Sense | 98.7% | 100% | 455 participants |
| Guo et al., 2019 | Photoplethysmography algorithm | 95.1% | 96.9% | Holter validation dataset |
| Perez et al., 2019 | Apple Heart Study | 84% PPV | Population screened | 400K+ participants |
The sensitivity numbers for passive, continuous PPG AFib screening are impressive, often above 93%. The positive predictive value (PPV) in the Apple Heart Study was only 84%, reflecting the challenge of low disease prevalence in population screening. A positive PPG screen still requires ECG confirmation before clinical action.
For a thorough breakdown of PPG-based AFib screening performance and limitations, see our PPG atrial fibrillation screening guide.
Other Arrhythmias
For arrhythmias beyond AFib, PPG performance drops substantially and no validated screening applications exist for routine wearable use.
| Arrhythmia | PPG Capability | Why PPG Falls Short |
|---|---|---|
| Atrial flutter | Limited, unreliable | Regular R-R intervals overlap with sinus rhythm |
| PVCs (isolated) | Can detect irregular beats | Cannot distinguish PAC vs PVC vs artifact |
| SVT | Detects elevated heart rate | Cannot identify P-wave relationship to QRS |
| Heart block (2nd/3rd degree) | Detects bradycardia | Cannot see AV conduction delay directly |
| Bundle branch block | Not detectable | Requires QRS morphology from ECG leads |
| ST elevation (ischemia) | Not detectable | Requires ST segment analysis from ECG |
| Ventricular tachycardia | May detect fast rate | Cannot assess for pulseless VT vs VF |
For any rhythm disorder beyond AFib, ECG remains mandatory for diagnosis. PPG can flag that something may be abnormal (unusual rate or rhythm irregularity), but it cannot characterize what that abnormality is.
Respiratory Rate Accuracy: PPG vs ECG
Both PPG and ECG can be used to estimate respiratory rate through respiratory-induced amplitude modulation, frequency modulation, and baseline wander. Neither is a direct measurement of breathing, but both can extract respiratory rate without requiring dedicated respiratory hardware.
| Method | MAE vs Reference (breaths/min) | Conditions | Source |
|---|---|---|---|
| PPG amplitude modulation | 1.9 | Seated rest, 8-24 breaths/min | Charlton et al., 2016 |
| PPG frequency modulation | 2.3 | Seated rest | Charlton et al., 2016 |
| ECG-derived respiratory rate | 1.5 | Seated rest | Clifton et al., 2007 |
| Wrist PPG (Polar) | 2.8 | Sleep | Böhm et al., 2019 |
| Finger PPG fusion method | 1.1 | Controlled breathing | Nilsson et al., 2000 |
PPG-derived respiratory rate performs comparably to ECG-derived respiratory rate at rest, with both methods achieving MAE around 1-3 breaths/min. Both deteriorate during rapid breathing or in the presence of motion. Neither replaces dedicated spirometry or chest expansion sensors for clinical respiratory monitoring.
The reference standard for respiratory rate varies by study (thoracic impedance, nasal thermistor, capnography), which makes direct numeric comparison across studies less clean than for heart rate.
Summary Table: PPG vs ECG Across Measurement Domains
| Measurement | PPG Accuracy vs ECG | Clinical Substitution? | Key Limitation |
|---|---|---|---|
| Resting heart rate | MAE 1-3 BPM | Yes, for screening | Degrades with motion |
| Exercise heart rate | MAE 4-7 BPM | Partial (within 5%) | Motion artifacts, high HR |
| RMSSD (resting) | r > 0.96 | Yes, for wellness HRV | Not for clinical HRV |
| SDNN (resting) | r > 0.94 | Yes, for wellness HRV | Not for clinical HRV |
| LF/HF ratio | r = 0.85 | No | PAT variability, noise |
| AFib detection | Sensitivity 93-98% | Screening only | ECG needed for confirmation |
| Other arrhythmias | Poor | No | No waveform morphology |
| Respiratory rate | MAE 1-3 bpm | Monitoring only | Not for clinical diagnosis |
| Ischemia (ST changes) | Not detectable | No | Requires ECG |
| P-wave morphology | Not detectable | No | Requires ECG |
Key Papers and Validation Sources
The accuracy data above draws from published validation literature. Two foundational papers are worth reading directly:
Schäfer A, Vagedes J. "How accurate is pulse rate variability as an estimate of heart rate variability? A review on studies comparing photoplethysmographic technology with an electrocardiograph." International Journal of Cardiology, 2013. https://doi.org/10.1016/j.ijcard.2012.03.119
Tison GH, et al. "Passive Detection of Atrial Fibrillation Using a Commercially Available Smartwatch." JAMA Cardiology, 2018. https://doi.org/10.1001/jamacardio.2018.3090
For the broader comparison of PPG and ECG as signal types, including waveform anatomy and timing relationships, see our PPG vs ECG comprehensive guide.
FAQ
Is PPG as accurate as ECG for measuring heart rate?
At rest, yes in practical terms. Modern wrist PPG devices achieve mean absolute errors of 1-3 BPM against simultaneous ECG, which is within the IEEE standard of 5 BPM for wearable heart rate monitors. During exercise, the gap grows to 4-7 BPM for wrist devices due to motion artifacts, which matters more if you are trying to stay within narrow training zones.
Can PPG be used for HRV analysis instead of ECG?
For wellness HRV at rest (RMSSD, SDNN from 5-minute recordings), PPG shows strong correlation with ECG references in healthy subjects, with r above 0.94-0.96 in multiple studies. For clinical HRV in patients with arrhythmias or during activity, PPG is not reliable enough. The pulse arrival time variability adds noise that does not represent cardiac autonomic variation.
What is the sensitivity of PPG for detecting atrial fibrillation?
Published studies report sensitivity of 93-98.7% and specificity of 84-100% for algorithm-driven PPG-based AFib detection compared to ECG reference. The Apple Heart Study found an 84% positive predictive value in a population screening context, meaning 16% of positive alerts were false positives. Any positive PPG-based AFib alert requires ECG confirmation.
Why can PPG detect atrial fibrillation but not other arrhythmias?
AFib produces a characteristic irregularly irregular pulse rhythm that is detectable in the PPG waveform's inter-beat interval sequence without needing to see the electrical waveform. Other arrhythmias (flutter, SVT, heart block, bundle branch block) are diagnosed based on P-wave shape, QRS morphology, or specific interval measurements that require the ECG electrical signal. PPG simply does not carry that information.
How does PPG accuracy for HRV change with exercise?
HRV accuracy from PPG degrades significantly during exercise. Frequency-domain metrics like LF/HF ratio show the steepest decline, with correlation dropping below 0.80 during light activity in some studies. Time-domain metrics like RMSSD are more resilient but still show increased error during movement. Most researchers recommend a 5-10 minute quiet recovery period before PPG HRV measurements intended for comparison with resting ECG references.
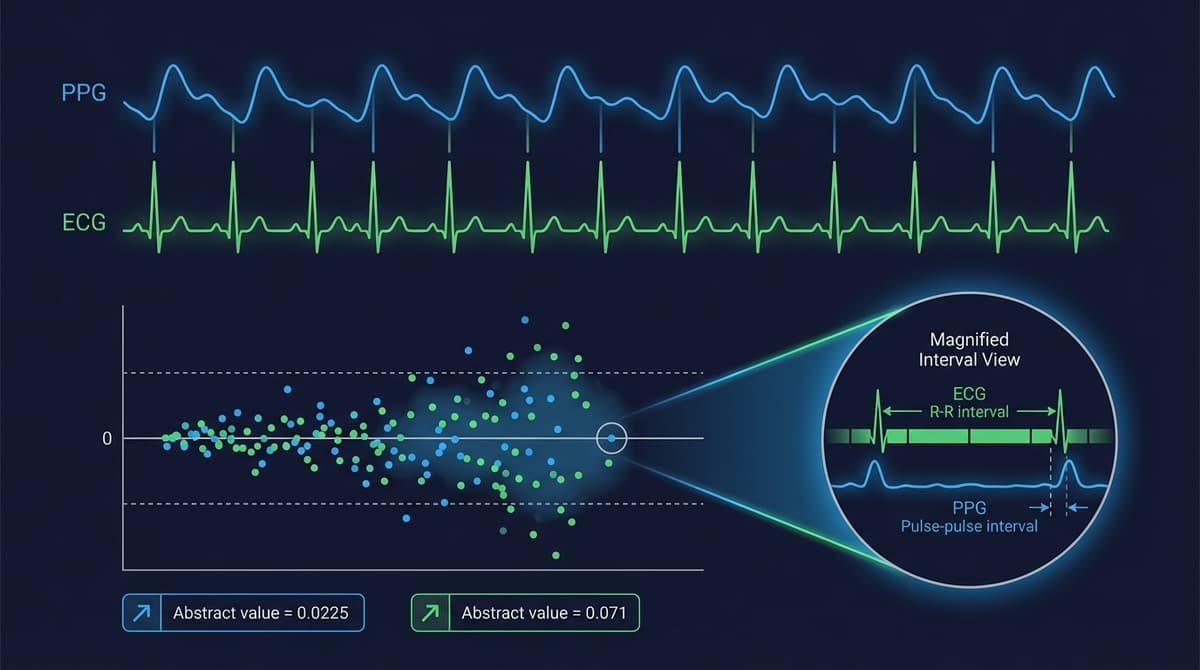
Does PPG measure the same intervals as ECG for HRV?
No. ECG measures R-R intervals between consecutive QRS complexes. PPG measures pulse-to-pulse intervals (PPI) between consecutive pulse peaks. The difference is the pulse arrival time (PAT), which is typically 200-400 ms. Because PAT is roughly constant beat-to-beat at rest, the variability in PPI is close to the variability in RR. But PAT fluctuates with blood pressure changes, sympathetic tone, and movement, adding a source of HRV-like variance to PPG that has no cardiac autonomic origin.
What measurement can ECG do that PPG cannot?
ECG can measure ST segment changes (ischemia), P-wave morphology (atrial abnormalities, AFib classification, flutter), QRS duration and morphology (bundle branch blocks, ventricular hypertrophy), QT interval (drug safety, channelopathies), and precise AV conduction timing (heart block). None of these require an optical signal. They are all about the electrical sequence within the heart, which PPG does not observe at all.