Learn PPG
Template Matching as a PPG Signal Quality Index
Template matching asks how much a PPG beat looks like a reference beat. The reference can be an average pulse or the previous beat. A high correlation means the shape repeated. It does not, by itself, mean the heart rhythm is normal, and published cut-offs belong to the study that chose them.
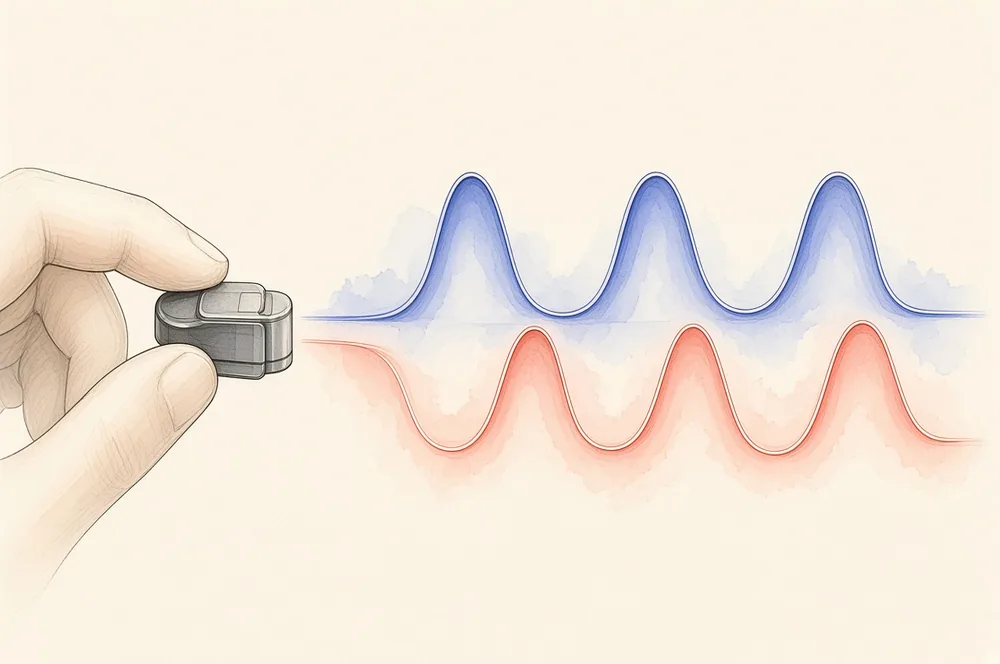
The comparison
A clean PPG beat has a repeatable outline: foot, systolic peak, and, when the site and the arteries allow it, a notch and a diastolic shoulder. Morphology is that outline. Template matching turns the outline into a score by correlating a new beat with a reference.
The reference is the part people under-specify. It might be an average of recent beats from the same recording, a beat the annotators called clean, or simply the previous beat. Those are different tests. Agreement with the previous beat fails when the shape jumps from one pulse to the next. Agreement with a resting average also fails when posture has slowly changed the true shape.
Charlton and colleagues computed a template-matching correlation coefficient (TMCC) on wrist PPG, next to signal-to-noise ratio and perfusion index (Charlton 2025). Across postures and sensor heights, TMCC moved with the other two metrics: higher when people were supine and when the sensor was nearer heart height, lower when they stood with the arm down. The paper does not publish one correlation cut that separates "usable" from "unusable" for every downstream task. It says heart rate might still be estimated from lower-quality signals than morphology needs.
Moscato's labels make that distinction explicit for wrist pulses. Basic quality meant the systolic peaks were clear enough for heart rate. High quality meant the systolic and diastolic waves were both visible (doi:10.3390/s22155831). A template score aimed at heart rate and a template score aimed at the notch are allowed to disagree.
A 70% beat-to-beat gate in a blood-pressure pipeline
Kolawole, Fan, Lao, and Koomson estimated systolic and diastolic pressure from MIMIC-III waveform features (PLOS Digital Health, 2026). The ICU source is not a wrist watch, and they say so. After filtering and aligning PPG with the arterial line, they cut 10-second windows with 50% overlap.
The quality score is a beat-to-beat Pearson correlation. Each window is split at local minima. Successive beats are aligned on their peaks, and the correlation between a beat and the one before it is the SQI. A high score means the pulses in that window look like each other. A low score is what they treat as noise or motion. They kept windows above 70%, citing earlier physiological-signal practice for that choice, and they describe 70% as strict enough to drop obvious sensor errors and motion while still leaving a training set.
Scroll sideways for the full table.
| Model | SBP without the gate | SBP with the gate | DBP without the gate | DBP with the gate |
|---|---|---|---|---|
| Support vector regression | 9.10 | 3.51 | 4.72 | 1.84 |
| Random forest | 7.27 | 3.35 | 7.40 | 3.14 |
| Gradient boosting | 8.29 | 3.46 | 4.28 | 1.80 |
The error drop in that table is real and it is not a pure SQI experiment. The paper's baseline trained on every window with demographic-independent folds. The enhanced models both applied the 70% gate and enforced demographic-aware splits. Mean absolute error on systolic pressure fell from 9.10, 7.27, and 8.29 mmHg (support vector regression, random forest, gradient boosting) to 3.51, 3.35, and 3.46 mmHg. Diastolic numbers fell from 4.72, 7.40, and 4.28 mmHg to 1.84, 3.14, and 1.80 mmHg. Use the table as evidence that this gated, rebalanced pipeline beat the ungated one on their split. Do not read it as "any 70% correlation cut removes 5 mmHg of error."
They also report that error still differed by age and race, and that leaving poor windows in made some of those gaps larger. A quality gate changes who remains in the dataset. That is an accuracy question and a fairness question.
Where template matching loses
Elgendi included "matching of systolic wave detectors" among eight fingertip indexes. Skewness beat it on that heat-stress set (Elgendi 2016). Detector agreement is a cousin of template matching, not the same calculation, and the result is a warning against assuming correlation is always the strongest single feature.
Template scores also punish genuine shape change. An ectopic beat, a shift from sitting to standing, or an arrhythmia can lower the correlation because the pulse really changed. Kolawole's score is consistency inside a 10-second window. A run of similar artifactual bumps could, in principle, correlate with each other. They describe low scores as noise or motion in the examples they show. They do not claim the correlation detects every physiological abnormality.
The implementation article goes further into dynamic time warping and running templates, including Li and Clifford. This page stays with the two full papers above and with Charlton's use of TMCC as a quality metric. Beat finding itself is a separate algorithm (/algorithms/template-matching-ppg).
The signal quality index is the parent guide. This page is educational. A correlation is not a blood-pressure reading and not a reason to ignore symptoms.
Research on this site
These records are public datasets, models, and papers linked from this guide.
 Determinants of photoplethysmography signal quality at the wristTemplate-matching correlation beside SNR and perfusion indexPLOS Digital Health · 2025
- Demographic subgroup-aware analysis of blood pressure predictive models70% beat-to-beat correlation before blood-pressure featuresPLOS Digital Health, 2026-10-15 · 2026
Go deeper
Frequently Asked Questions
What is template matching SQI?
A quality score from the similarity between a PPG beat and a reference beat. The reference may be a template or the previous beat. Charlton et al. 2025 report a template-matching correlation coefficient alongside SNR and perfusion index (Charlton 2025).
What does a 70% SQI mean?
In Kolawole et al. 2026 it means the beat-to-beat Pearson correlation inside a 10-second MIMIC-III window exceeded 0.70, and the window was kept for blood-pressure features (doi:10.1371/journal.pdig.0001687). It is not a universal clinical cut-off.
Did that 70% gate alone produce the lower blood-pressure error?
The paper's lower errors compare a pipeline that gated at 70% and used demographic-aware folds with a pipeline that used every window and did not. Both changes were in the enhanced models. Systolic MAE fell, for example, from 7.27 to 3.35 mmHg for the random forest.
Can a normal rhythm fail a template score?
Yes, if the pulse shape changes from beat to beat for a physiological reason, or if the template was built in a different posture. Moscato et al. 2022 separate peaks-clear-enough-for-heart-rate from a waveform clean enough for diastolic features (doi:10.3390/s22155831).