Learn PPG
What Is Sleep Staging?
Sleep staging is the process of labeling each 30-second epoch of a sleep recording as one of five stages: wake (W), N1, N2, N3 or REM (stage R). Under the American Academy of Sleep Medicine (AASM) rules, a trained scorer reads EEG brain waves, eye movements (EOG) and chin muscle tone (EMG) from a polysomnogram to make each call. N1 and N2 are lighter non-REM sleep, N3 is slow-wave or deep sleep, and REM is the stage with rapid eye movements and low muscle tone. The result is a hypnogram. Even trained human scorers agree on only about 83% of epochs, and consumer wearables, which do not record EEG, estimate stages less reliably.
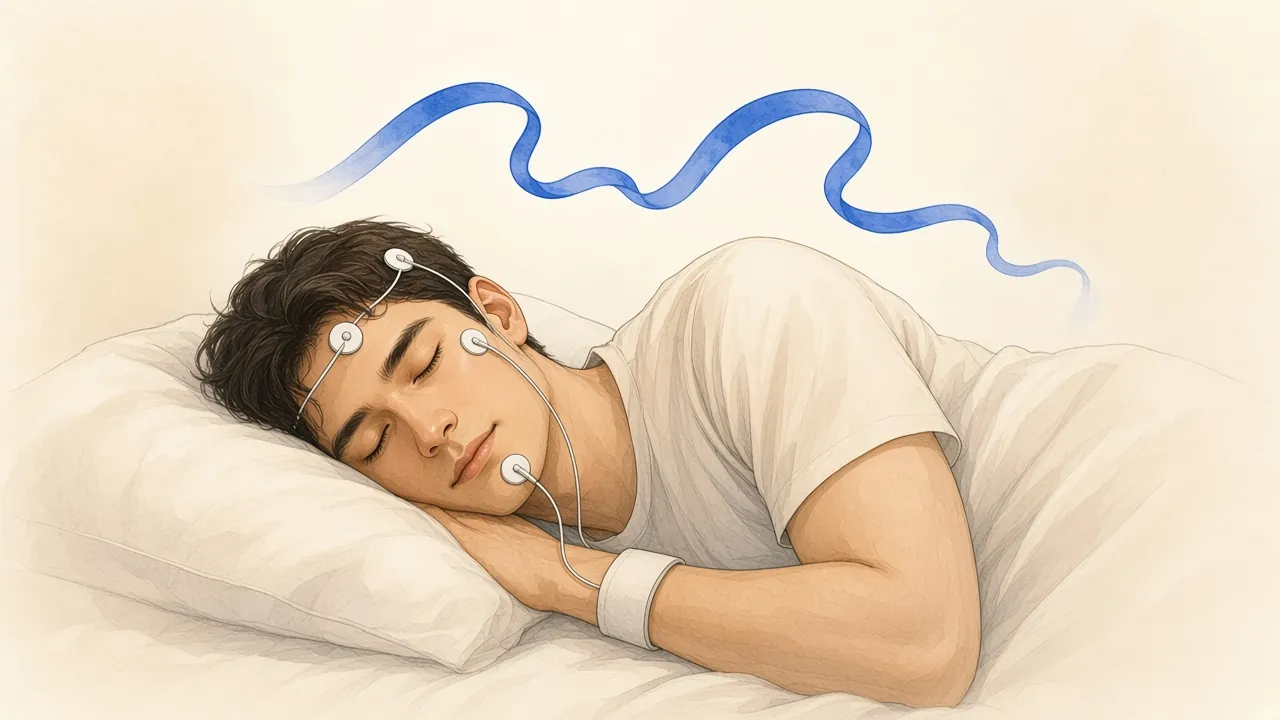
How sleep is scored
Sleep staging turns an overnight recording into a stage-by-stage timeline. The recording is cut into 30-second epochs, and each epoch gets one label. Plotted across the night, those labels make a hypnogram.
The rules come from the AASM Manual for the Scoring of Sleep and Associated Events. The current edition is version 3, released in February 2023. It is a paid manual, and its rule text was not opened for this page. What follows relies on peer-reviewed papers that describe the rules.
The AASM's visual scoring task force explained the framework when it replaced the 1968 Rechtschaffen and Kales (R&K) manual (Silber et al., Journal of Clinical Sleep Medicine, 2007). It recommended three EEG derivations, two eye-movement (EOG) channels and one chin muscle (EMG) channel, and it kept scoring by 30-second epochs. The recommended EEG derivations are F4-M1, C4-M1 and O2-M1, sampling the frontal, central and occipital regions (Moser et al., Sleep, 2009). Those leads match where the key waves are strongest: K complexes and slow waves frontally, spindles centrally, and alpha rhythm over the back of the head.
A night on a hypnogram
A hypnogram is the night's epoch labels drawn as a stepped line. In adults the stages repeat in cycles. A StatPearls review describes four to five cycles a night, each roughly 90 to 110 minutes, usually running N1, N2, N3, back to N2, then REM (Patel et al., StatPearls, 2024). The first REM period is short, about 10 minutes. As the night goes on, REM periods get longer and time in deep sleep shrinks, so N3 is concentrated early in the night and REM late.
Interactive · illustrative night, not a recording
A hypnogram: one label per 30-second epoch, plotted across the night
1h 24m after lights out · epoch 169 of 936 · N2 · cycle 1
Whole illustrative night: 7h 48m in bed, 7h 21m asleep. Of sleep time: N1 4%, N2 49%, N3 20%, REM 27%.
The five AASM sleep stages
| Stage | Also called | What the scorer looks for |
|---|---|---|
| W | Wake | Alpha rhythm in relaxed wake with eyes closed; eye blinks and movements |
| N1 | Light sleep, stage 1 | Alpha rhythm attenuated and replaced by low-amplitude, mixed-frequency activity for more than half the epoch |
| N2 | Light sleep, stage 2 | K complexes or sleep spindles |
| N3 | Deep sleep, slow-wave sleep | Slow waves taking up more than 20% of the epoch, with amplitude and frequency criteria |
| R | REM sleep | Rapid eye movements, low-amplitude mixed-frequency EEG, low chin muscle tone |
The N1 wording is quoted from the manual in Rosenberg and Van Hout, Journal of Clinical Sleep Medicine, 2013, which also describes the N2 waveforms, the 20% slow-wave threshold for N3 and the three features of stage R. The task force found that attenuation of the alpha rhythm was the most valid EEG marker of sleep onset, with alternative rules for people who do not produce alpha (Silber et al. 2007).
Interactive · synthetic traces, not a recording
What the scorer looks for in each stage
N2
- EEG: K complexes or sleep spindles on a mixed background
- K complexes last about one second
N1, N2 and N3 together are non-REM (NREM) sleep. Consumer apps usually collapse them further: "light" sleep tends to mean N1 plus N2, and "deep" sleep means N3.
Each call is made on one 30-second epoch at a time, and several rules are written as shares of that epoch: N1 needs low-amplitude mixed-frequency activity for more than half of it, and N3 needs slow waves in more than 20% of it. An epoch near a threshold can go either way, which is part of why scorers disagree.
Interactive · conceptual sketch
30 seconds
One epoch, one label. The AASM task force kept 30-second epochs when it replaced R&K.
120 per hour
An 8-hour recording is 960 epochs. Each one gets W, N1, N2, N3 or R.
Rules use shares
N1 needs low-amplitude mixed activity for more than half the epoch; N3 needs slow waves in more than 20%.
Scored N2: slow waves take up 20% or less, so this epoch stays N2 if spindles or K complexes defined it.
What changed from R&K
The 1968 R&K manual used stages 1 to 4 plus REM and a "movement time" category. The AASM rules changed that in a few ways (Moser et al. 2009; Silber et al. 2007):
Stages 3 and 4 were merged into N3. The task force found no evidence to justify splitting slow-wave sleep in two.
Movement time was dropped, and major body movements were defined instead.
REM was renamed stage R, and the rules for when a REM period starts and ends were simplified.
Frontal and occipital EEG leads were added to the central lead.
The change shifts the numbers. Moser and colleagues scored the same overnight recordings from 72 adults aged 21 to 86 under both systems. Under AASM rules, N1 rose by 10.6 minutes and N3 by 9.1 minutes compared with R&K stage 1 and stages 3 plus 4, while N2 fell by 20.5 minutes. Wake after sleep onset was about 4 minutes longer. Total sleep time, sleep efficiency and sleep latency did not change. The authors concluded that new normative data were needed for the AASM standard, which is worth remembering when an older paper's stage percentages are compared with a newer one.
How reliable is human scoring?
Sleep staging is a judgment call, and trained scorers disagree. In the AASM inter-scorer reliability program, more than 2,500 scorers made over 3.2 million decisions on 1,800 epochs (Rosenberg and Van Hout 2013):
| Stage (majority score) | Agreement with the majority |
|---|---|
| All stages | 82.6% |
| W | 84.1% |
| N2 | 85.2% |
| R | Highest of all stages |
| N3 | 67.4% |
| N1 | 63.0% |
Almost all of the N3 disagreement (32.3%) was with N2. Scorers also struggled at transitions: the last wake epoch before sleep, the first N2 epoch after N1, and the first REM epoch after N2.
A study on the SIESTA database found similar overall numbers between pairs of expert scorers: 82.0% agreement (Cohen's kappa 0.76) under AASM rules versus 80.6% (kappa 0.68) under R&K (Danker-Hopfe et al., Journal of Sleep Research, 2009). Agreement improved for every stage except N2.
This ceiling matters for automated scoring. An algorithm trained on one scorer's labels inherits that scorer's choices, and a score near 80% agreement is close to how well people agree with each other.
How stages change across life
Stage proportions are not fixed. A meta-analysis of 65 studies with 3,577 healthy people aged 5 to 102 found that in adults, the percentage of slow-wave sleep and of REM sleep fell with age, while stage 1 and stage 2 percentages and wake after sleep onset rose (Ohayon et al., Sleep, 2004). The authors noted that how carefully participants were screened for health problems changed the size of these effects. Those studies used R&K scoring. Typical stage shares are on the sleep stages chart.
The paper shows the lifespan trend as minutes per night in its Figure 2, without a table. Read off that chart, slow-wave sleep falls from about 75 minutes at age 25 to about 22 minutes at 85, and wake after sleep onset rises from about 18 to about 81 minutes. The authors' text puts that wake rise at about 10 minutes per decade from age 30. The chart below uses the read-off values, which carry a few minutes of reading error.
Interactive · values read from a published figure
How a night's stages change with age
Age 25: stage 1 30 min (7%), stage 2 224 min (52%), slow-wave 75 min (18%), REM 99 min (23%), awake after sleep onset about 18 min. Percentages are of sleep time.
Show the values as a table
| Age | Stage 1 | Stage 2 | Slow-wave | REM | WASO |
|---|---|---|---|---|---|
| 5 | 54 | 181 | 191 | 108 | 5 |
| 10 | 29 | 225 | 154 | 114 | 8 |
| 15 | 29 | 233 | 104 | 98 | 14 |
| 25 | 30 | 224 | 75 | 99 | 18 |
| 35 | 25 | 223 | 57 | 91 | 21 |
| 45 | 23 | 212 | 60 | 85 | 37 |
| 55 | 18 | 204 | 73 | 86 | 45 |
| 65 | 30 | 213 | 50 | 70 | 58 |
| 75 | 38 | 197 | 45 | 66 | 77 |
| 85 | 48 | 179 | 22 | 70 | 81 |
Minutes per night, approximate (±5 min).
Sleep staging in wearables
A watch or ring does not record EEG, EOG or chin EMG, so it cannot apply the AASM rules. It estimates stages from movement (actigraphy), pulse rate and heart rate variability from PPG, and sometimes skin temperature or breathing rate. A model then predicts which stage those signals most likely match.
Sleep versus wake is the easier part. In a lab study of 53 healthy adults, six devices agreed with polysomnography on 86% to 89% of epochs for sleep vs wake. For the full set of stages, agreement fell to 50% to 65%, with Cohen's kappa from 0.20 to 0.52 (Miller et al., Sensors, 2022). The authors judged all six valid for sleep timing and duration but said all needed improvement for specific stages.
Interactive · diagram plus published results
EEG
Brain waves from frontal, central and occipital leads
Used to score stages
EOG
Eye movements, two channels
Used to score stages
Chin EMG
Muscle tone
Used to score stages
ECG, pulse oximetry, airflow, breathing effort
Heart and breathing channels used for other scoring, such as apneas
The AASM rules are written for these three signals. A scorer applies them epoch by epoch.
Epoch-by-epoch agreement
Rosenberg & Van Hout 2013
Miller et al. 2022
Miller et al. 2022
Method details, features and model families are in PPG sleep staging algorithms and the sleep staging algorithm page. Device-level results are on sleep tracker accuracy, and published research results sit on the sleep staging leaderboard. Open data with both wearable signals and polysomnography labels is listed under wearable sleep staging datasets, including DREAMT, MESA and Sleep-EDF. Foundation models such as AnySleep are trained to stage sleep across many recordings. For the research state of the art, see PPG sleep tracking.
A different approach skips the five stages altogether. Cardiopulmonary coupling analysis measures how closely heart rate variability and breathing move together. It sorts sleep into stable and unstable periods rather than N1, N2, N3 and REM (Thomas et al., Sleep, 2005).
Sleep stages also matter for breathing scores. An apnea-hypopnea index (AHI) is calculated per hour of sleep, and arousals from sleep are part of the hypopnea rule, so both depend on sleep scoring. The sleep apnea page covers how PPG is used to screen for breathing events.
This page explains how sleep staging works. It is not a diagnosis and not medical advice. A sleep study is scored by trained technologists and interpreted by a sleep clinician.
Frequently Asked Questions
What is sleep staging?
Sleep staging is labeling each 30-second epoch of a sleep recording as wake, N1, N2, N3 or REM (stage R). Under AASM rules a trained scorer uses EEG, eye-movement (EOG) and chin muscle (EMG) signals from a polysomnogram. The labels across the night form a hypnogram.
What are the 5 stages of sleep?
The AASM scores five stages: wake (W), N1 and N2 (lighter non-REM sleep), N3 (slow-wave or deep sleep) and R (REM sleep). Older R&K scoring used stages 1 to 4 plus REM; the AASM merged stages 3 and 4 into N3 (Silber et al. 2007, doi:10.5664/jcsm.26814).
How is N3 deep sleep scored?
An epoch is scored N3 when slow waves take up more than 20% of it, with amplitude and frequency criteria set in the AASM manual. Even so, N3 is hard to agree on: in the AASM inter-scorer program, agreement on N3 epochs was 67.4%, and almost all disagreement was with N2 (Rosenberg and Van Hout 2013, doi:10.5664/jcsm.2350).
How accurate is human sleep stage scoring?
Agreement is about 83%. In the AASM inter-scorer reliability program, over 2,500 scorers agreed with the majority score on 82.6% of epochs on average, with the lowest agreement for N1 (63.0%) and N3 (67.4%) (Rosenberg and Van Hout 2013, doi:10.5664/jcsm.2350).
Can a smartwatch measure sleep stages?
It estimates them. Watches and rings do not record EEG, so they infer stages from movement and heart signals. In a 53-adult lab study, six devices agreed with polysomnography on 86% to 89% of epochs for sleep vs wake, but only 50% to 65% for individual stages (Miller et al. 2022, doi:10.3390/s22166317).
Why do sleep stage percentages differ between studies?
Scoring rules, age and screening all matter. Re-scoring the same recordings under AASM instead of R&K rules raised N1 and N3 time and lowered N2 (Moser et al. 2009, doi:10.1093/sleep/32.2.139). Slow-wave and REM percentages also fall with age in adults (Ohayon et al. 2004, doi:10.1093/sleep/27.7.1255).