Task leaderboard

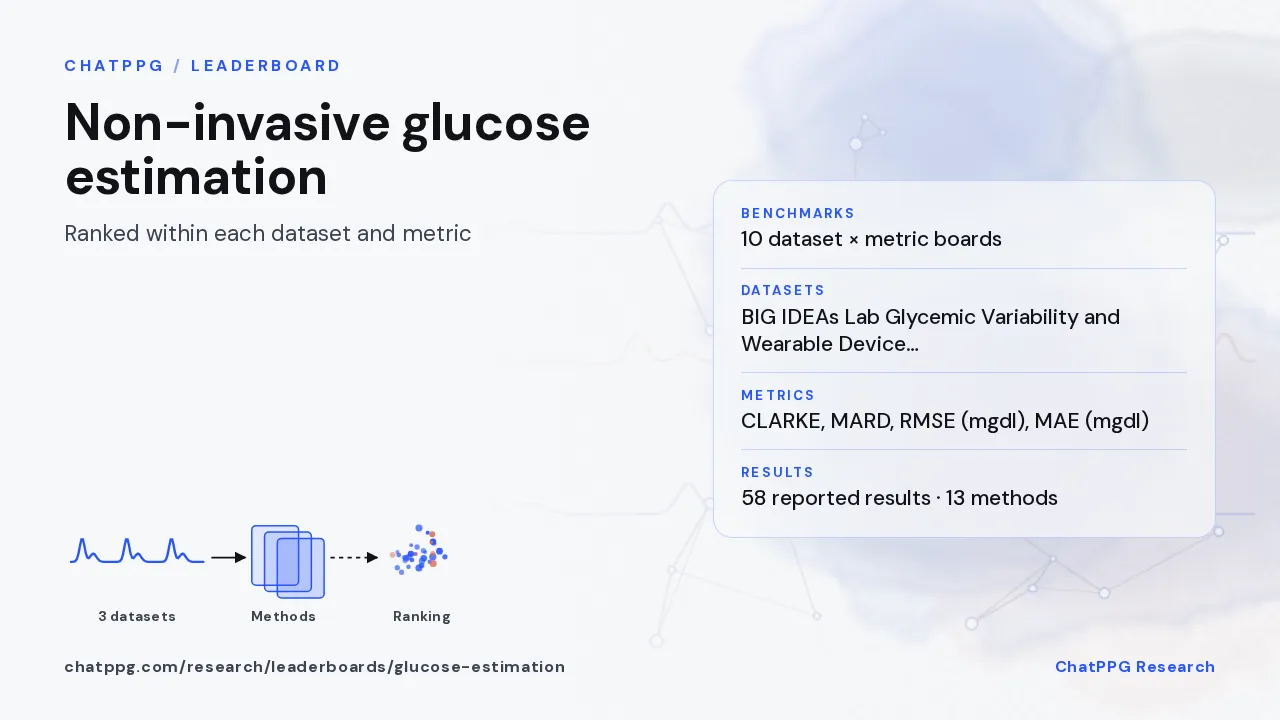
Non-invasive glucose estimation

Published PPG and wearable glucose estimation results per dataset and metric (MAE, RMSE, MARD, Clarke zone A), with subject-disjoint reproductions.

Non-invasive glucose estimation: ChatPPG research summary card

Task leaderboard

Glucose estimation

9 reported results · Leaderboard page · Dataset details

Glucose estimation: PPG Signals for Blood Glucose Measurement (Kermani / Mendeley), Clarke error grid zone A (%). Reported rankings; evaluation protocols may differ.
RankMethod & evaluationClarke error grid zone A (%)↑ Higher is better
1PLS (Islam)

PPG features + partial least squares (Islam et al. 2021 method) [reproduction]

Evaluation details

Trained on all VitalDB data, tested on the 67 MUST (Kermani) recordings (Supraja et al. 2026 out-of-distribution test). MUST glucose spans only 88-183 mg/dL, so mean prediction scores well; R² was below zero for every model.

Reported as of: 2026-10-16

86.57
2MFCC + XGBoost (Prabha)

MFCC features + XGBoost (Prabha et al. 2022 method) [reproduction]

Evaluation details

Trained on all VitalDB data, tested on the 67 MUST (Kermani) recordings (Supraja et al. 2026 out-of-distribution test). MUST glucose spans only 88-183 mg/dL, so mean prediction scores well; R² was below zero for every model.

Reported as of: 2026-10-16

83.58
3Mean baseline

Mean-of-training-set baseline [reproduction]

Evaluation details

Trained on all VitalDB data, tested on the 67 MUST (Kermani) recordings (Supraja et al. 2026 out-of-distribution test). MUST glucose spans only 88-183 mg/dL, so mean prediction scores well; R² was below zero for every model.

Reported as of: 2026-10-16

77.61
4ResNet34-1s

ResNet34, 1 s segments (Zeynali et al. 2025)

Evaluation details

Original paper: trained on VitalDB (random 70/15/15 split), external test on the MUST (Kermani) dataset with 1 s peak-centred segments resampled to 100 Hz (Tables 6-7).

Reported as of: 2026-10-16

76.6
5XGBoost (Gupta)

PPG features + XGBoost (Gupta et al. 2021 method) [reproduction]

Evaluation details

Trained on all VitalDB data, tested on the 67 MUST (Kermani) recordings (Supraja et al. 2026 out-of-distribution test). MUST glucose spans only 88-183 mg/dL, so mean prediction scores well; R² was below zero for every model.

Reported as of: 2026-10-16

75.6
6ResNet34 (Zeynali)

ResNet34 on raw 1 s PPG (Zeynali et al. 2025 method) [reproduction]

Evaluation details

Trained on all VitalDB data, tested on the 67 MUST (Kermani) recordings (Supraja et al. 2026 out-of-distribution test). MUST glucose spans only 88-183 mg/dL, so mean prediction scores well; R² was below zero for every model.

Reported as of: 2026-10-16

72.17
7VGG16-1s

VGG16, 1 s segments (Zeynali et al. 2025)

Evaluation details

Original paper: trained on VitalDB (random 70/15/15 split), external test on the MUST (Kermani) dataset with 1 s peak-centred segments resampled to 100 Hz (Tables 6-7).

Reported as of: 2026-10-16

71.3
8CNN-LSTM-Att-1s

CNN-LSTM-Attention, 1 s segments (Zeynali et al. 2025)

Evaluation details

Original paper: trained on VitalDB (random 70/15/15 split), external test on the MUST (Kermani) dataset with 1 s peak-centred segments resampled to 100 Hz (Tables 6-7).

Reported as of: 2026-10-16

69
91D-CNN (Alghlayini)

1D-CNN on raw PPG (Alghlayini et al. 2023 method) [reproduction]

Evaluation details

Trained on all VitalDB data, tested on the 67 MUST (Kermani) recordings (Supraja et al. 2026 out-of-distribution test). MUST glucose spans only 88-183 mg/dL, so mean prediction scores well; R² was below zero for every model.

Reported as of: 2026-10-16

62.69

Rows are ranked only within this task × dataset × metric. Protocols can differ; read each method’s evaluation details before comparing.

All reported results for this task (10 benchmarks)

Rankings apply within each dataset and metric. Open evaluation details for differences in protocols.

BIG IDEAs Lab Glycemic Variability and Wearable Device Data: Clarke zone A

Glucose estimation: BIG IDEAs Lab Glycemic Variability and Wearable Device Data, Clarke error grid zone A (%). Reported rankings; evaluation protocols may differ.
RankMethod & evaluationClarke error grid zone A (%)↑ Higher is better
1XGBoost (Karunarathna)

XGBoost regression (Karunarathna & Liang 2025)

Evaluation details

236 wearable + circadian + demographic features, no food logs; random 80/20 split of 5-min epochs (same participants in train and test), Clarke zones from one of the train-test splits (Table 3). Not subject-independent, so not comparable with LOPOCV rows.

Reported as of: 2026-10-16

94.2
2Random forest (Karunarathna)

Random forest regression (Karunarathna & Liang 2025)

Evaluation details

236 wearable + circadian + demographic features, no food logs; random 80/20 split of 5-min epochs (same participants in train and test), Clarke zones from one of the train-test splits (Table 3). Not subject-independent, so not comparable with LOPOCV rows.

Reported as of: 2026-10-16

89.1

BIG IDEAs Lab Glycemic Variability and Wearable Device Data: MARD

Glucose estimation: BIG IDEAs Lab Glycemic Variability and Wearable Device Data, MARD (%). Reported rankings; evaluation protocols may differ.
RankMethod & evaluationMARD (%)↓ Lower is better
1XGBoost (Karunarathna)

XGBoost regression (Karunarathna & Liang 2025)

Evaluation details

236 wearable + circadian + demographic features, no food logs; random 80/20 split of 5-min epochs (same participants in train and test), mean of 20 random seeds. Not subject-independent, so not comparable with LOPOCV rows.

Reported as of: 2026-10-16

7.1
2Random forest (Karunarathna)

Random forest regression (Karunarathna & Liang 2025)

Evaluation details

236 wearable + circadian + demographic features, no food logs; random 80/20 split of 5-min epochs (same participants in train and test), mean of 20 random seeds. Not subject-independent, so not comparable with LOPOCV rows.

Reported as of: 2026-10-16

9.7
3Bent 2021 personalized

Personalized gradient boosting (Bent et al. 2021)

Evaluation details

Personalized gradient-boosted model: trained on the first half of each participant's own data, tested on the second half. MARD here is the paper's MAPE against Dexcom G6.

Source: Bent et al. 2021, npj Digit Med

Reported as of: 2026-10-16

13.26
4Bent 2021 population

Population gradient boosting, LOPOCV (Bent et al. 2021)

Evaluation details

Gradient-boosted model on Empatica E4 features + food logs, 5-min CGM targets; leave-one-person-out CV across 16 participants (mean over participants). MARD here is the paper's MAPE against Dexcom G6.

Source: Bent et al. 2021, npj Digit Med

Reported as of: 2026-10-16

14.33

BIG IDEAs Lab Glycemic Variability and Wearable Device Data: RMSE (mg/dL)

Glucose estimation: BIG IDEAs Lab Glycemic Variability and Wearable Device Data, Glucose RMSE (mg/dL). Reported rankings; evaluation protocols may differ.
RankMethod & evaluationGlucose RMSE (mg/dL)↓ Lower is better
1XGBoost (Karunarathna)

XGBoost regression (Karunarathna & Liang 2025)

Evaluation details

236 wearable + circadian + demographic features, no food logs; random 80/20 split of 5-min epochs (same participants in train and test), mean of 20 random seeds. Not subject-independent, so not comparable with LOPOCV rows.

Reported as of: 2026-10-16

11.9
2Random forest (Karunarathna)

Random forest regression (Karunarathna & Liang 2025)

Evaluation details

236 wearable + circadian + demographic features, no food logs; random 80/20 split of 5-min epochs (same participants in train and test), mean of 20 random seeds. Not subject-independent, so not comparable with LOPOCV rows.

Reported as of: 2026-10-16

15.6
3Bent 2021 personalized

Personalized gradient boosting (Bent et al. 2021)

Evaluation details

Personalized gradient-boosted model: trained on the first half of each participant's own data, tested on the second half. MARD here is the paper's MAPE against Dexcom G6.

Source: Bent et al. 2021, npj Digit Med

Reported as of: 2026-10-16

21.1
4Bent 2021 population

Population gradient boosting, LOPOCV (Bent et al. 2021)

Evaluation details

Gradient-boosted model on Empatica E4 features + food logs, 5-min CGM targets; leave-one-person-out CV across 16 participants (mean over participants). MARD here is the paper's MAPE against Dexcom G6.

Source: Bent et al. 2021, npj Digit Med

Reported as of: 2026-10-16

21.22

PPG Signals for Blood Glucose Measurement (Kermani / Mendeley): Clarke zone A

Glucose estimation: PPG Signals for Blood Glucose Measurement (Kermani / Mendeley), Clarke error grid zone A (%). Reported rankings; evaluation protocols may differ.
RankMethod & evaluationClarke error grid zone A (%)↑ Higher is better
1PLS (Islam)

PPG features + partial least squares (Islam et al. 2021 method) [reproduction]

Evaluation details

Trained on all VitalDB data, tested on the 67 MUST (Kermani) recordings (Supraja et al. 2026 out-of-distribution test). MUST glucose spans only 88-183 mg/dL, so mean prediction scores well; R² was below zero for every model.

Reported as of: 2026-10-16

86.57
2MFCC + XGBoost (Prabha)

MFCC features + XGBoost (Prabha et al. 2022 method) [reproduction]

Evaluation details

Trained on all VitalDB data, tested on the 67 MUST (Kermani) recordings (Supraja et al. 2026 out-of-distribution test). MUST glucose spans only 88-183 mg/dL, so mean prediction scores well; R² was below zero for every model.

Reported as of: 2026-10-16

83.58
3Mean baseline

Mean-of-training-set baseline [reproduction]

Evaluation details

Trained on all VitalDB data, tested on the 67 MUST (Kermani) recordings (Supraja et al. 2026 out-of-distribution test). MUST glucose spans only 88-183 mg/dL, so mean prediction scores well; R² was below zero for every model.

Reported as of: 2026-10-16

77.61
4ResNet34-1s

ResNet34, 1 s segments (Zeynali et al. 2025)

Evaluation details

Original paper: trained on VitalDB (random 70/15/15 split), external test on the MUST (Kermani) dataset with 1 s peak-centred segments resampled to 100 Hz (Tables 6-7).

Reported as of: 2026-10-16

76.6
5XGBoost (Gupta)

PPG features + XGBoost (Gupta et al. 2021 method) [reproduction]

Evaluation details

Trained on all VitalDB data, tested on the 67 MUST (Kermani) recordings (Supraja et al. 2026 out-of-distribution test). MUST glucose spans only 88-183 mg/dL, so mean prediction scores well; R² was below zero for every model.

Reported as of: 2026-10-16

75.6
6ResNet34 (Zeynali)

ResNet34 on raw 1 s PPG (Zeynali et al. 2025 method) [reproduction]

Evaluation details

Trained on all VitalDB data, tested on the 67 MUST (Kermani) recordings (Supraja et al. 2026 out-of-distribution test). MUST glucose spans only 88-183 mg/dL, so mean prediction scores well; R² was below zero for every model.

Reported as of: 2026-10-16

72.17
7VGG16-1s

VGG16, 1 s segments (Zeynali et al. 2025)

Evaluation details

Original paper: trained on VitalDB (random 70/15/15 split), external test on the MUST (Kermani) dataset with 1 s peak-centred segments resampled to 100 Hz (Tables 6-7).

Reported as of: 2026-10-16

71.3
8CNN-LSTM-Att-1s

CNN-LSTM-Attention, 1 s segments (Zeynali et al. 2025)

Evaluation details

Original paper: trained on VitalDB (random 70/15/15 split), external test on the MUST (Kermani) dataset with 1 s peak-centred segments resampled to 100 Hz (Tables 6-7).

Reported as of: 2026-10-16

69
91D-CNN (Alghlayini)

1D-CNN on raw PPG (Alghlayini et al. 2023 method) [reproduction]

Evaluation details

Trained on all VitalDB data, tested on the 67 MUST (Kermani) recordings (Supraja et al. 2026 out-of-distribution test). MUST glucose spans only 88-183 mg/dL, so mean prediction scores well; R² was below zero for every model.

Reported as of: 2026-10-16

62.69

PPG Signals for Blood Glucose Measurement (Kermani / Mendeley): MAE (mg/dL)

Glucose estimation: PPG Signals for Blood Glucose Measurement (Kermani / Mendeley), Glucose MAE (mg/dL). Reported rankings; evaluation protocols may differ.
RankMethod & evaluationGlucose MAE (mg/dL)↓ Lower is better
1PLS (Islam)

PPG features + partial least squares (Islam et al. 2021 method) [reproduction]

Evaluation details

Trained on all VitalDB data, tested on the 67 MUST (Kermani) recordings (Supraja et al. 2026 out-of-distribution test). MUST glucose spans only 88-183 mg/dL, so mean prediction scores well; R² was below zero for every model.

Reported as of: 2026-10-16

13.37
2MFCC + XGBoost (Prabha)

MFCC features + XGBoost (Prabha et al. 2022 method) [reproduction]

Evaluation details

Trained on all VitalDB data, tested on the 67 MUST (Kermani) recordings (Supraja et al. 2026 out-of-distribution test). MUST glucose spans only 88-183 mg/dL, so mean prediction scores well; R² was below zero for every model.

Reported as of: 2026-10-16

14.23
3ResNet34-1s

ResNet34, 1 s segments (Zeynali et al. 2025)

Evaluation details

Original paper: trained on VitalDB (random 70/15/15 split), external test on the MUST (Kermani) dataset with 1 s peak-centred segments resampled to 100 Hz (Tables 6-7).

Reported as of: 2026-10-16

14.8
4Mean baseline

Mean-of-training-set baseline [reproduction]

Evaluation details

Trained on all VitalDB data, tested on the 67 MUST (Kermani) recordings (Supraja et al. 2026 out-of-distribution test). MUST glucose spans only 88-183 mg/dL, so mean prediction scores well; R² was below zero for every model.

Reported as of: 2026-10-16

16
5ResNet34 (Zeynali)

ResNet34 on raw 1 s PPG (Zeynali et al. 2025 method) [reproduction]

Evaluation details

Trained on all VitalDB data, tested on the 67 MUST (Kermani) recordings (Supraja et al. 2026 out-of-distribution test). MUST glucose spans only 88-183 mg/dL, so mean prediction scores well; R² was below zero for every model.

Reported as of: 2026-10-16

16.33
6XGBoost (Gupta)

PPG features + XGBoost (Gupta et al. 2021 method) [reproduction]

Evaluation details

Trained on all VitalDB data, tested on the 67 MUST (Kermani) recordings (Supraja et al. 2026 out-of-distribution test). MUST glucose spans only 88-183 mg/dL, so mean prediction scores well; R² was below zero for every model.

Reported as of: 2026-10-16

16.69
7VGG16-1s

VGG16, 1 s segments (Zeynali et al. 2025)

Evaluation details

Original paper: trained on VitalDB (random 70/15/15 split), external test on the MUST (Kermani) dataset with 1 s peak-centred segments resampled to 100 Hz (Tables 6-7).

Reported as of: 2026-10-16

17
8CNN-LSTM-Att-1s

CNN-LSTM-Attention, 1 s segments (Zeynali et al. 2025)

Evaluation details

Original paper: trained on VitalDB (random 70/15/15 split), external test on the MUST (Kermani) dataset with 1 s peak-centred segments resampled to 100 Hz (Tables 6-7).

Reported as of: 2026-10-16

17.1
91D-CNN (Alghlayini)

1D-CNN on raw PPG (Alghlayini et al. 2023 method) [reproduction]

Evaluation details

Trained on all VitalDB data, tested on the 67 MUST (Kermani) recordings (Supraja et al. 2026 out-of-distribution test). MUST glucose spans only 88-183 mg/dL, so mean prediction scores well; R² was below zero for every model.

Reported as of: 2026-10-16

18.21

PPG Signals for Blood Glucose Measurement (Kermani / Mendeley): MARD

Glucose estimation: PPG Signals for Blood Glucose Measurement (Kermani / Mendeley), MARD (%). Reported rankings; evaluation protocols may differ.
RankMethod & evaluationMARD (%)↓ Lower is better
1PLS (Islam)

PPG features + partial least squares (Islam et al. 2021 method) [reproduction]

Evaluation details

Trained on all VitalDB data, tested on the 67 MUST (Kermani) recordings (Supraja et al. 2026 out-of-distribution test). MUST glucose spans only 88-183 mg/dL, so mean prediction scores well; R² was below zero for every model.

Reported as of: 2026-10-16

10.67
2MFCC + XGBoost (Prabha)

MFCC features + XGBoost (Prabha et al. 2022 method) [reproduction]

Evaluation details

Trained on all VitalDB data, tested on the 67 MUST (Kermani) recordings (Supraja et al. 2026 out-of-distribution test). MUST glucose spans only 88-183 mg/dL, so mean prediction scores well; R² was below zero for every model.

Reported as of: 2026-10-16

11.69
3ResNet34-1s

ResNet34, 1 s segments (Zeynali et al. 2025)

Evaluation details

Original paper: trained on VitalDB (random 70/15/15 split), external test on the MUST (Kermani) dataset with 1 s peak-centred segments resampled to 100 Hz (Tables 6-7).

Reported as of: 2026-10-16

12.8
4CNN-LSTM-Att-1s

CNN-LSTM-Attention, 1 s segments (Zeynali et al. 2025)

Evaluation details

Original paper: trained on VitalDB (random 70/15/15 split), external test on the MUST (Kermani) dataset with 1 s peak-centred segments resampled to 100 Hz (Tables 6-7).

Reported as of: 2026-10-16

13
5Mean baseline

Mean-of-training-set baseline [reproduction]

Evaluation details

Trained on all VitalDB data, tested on the 67 MUST (Kermani) recordings (Supraja et al. 2026 out-of-distribution test). MUST glucose spans only 88-183 mg/dL, so mean prediction scores well; R² was below zero for every model.

Reported as of: 2026-10-16

14.13
6XGBoost (Gupta)

PPG features + XGBoost (Gupta et al. 2021 method) [reproduction]

Evaluation details

Trained on all VitalDB data, tested on the 67 MUST (Kermani) recordings (Supraja et al. 2026 out-of-distribution test). MUST glucose spans only 88-183 mg/dL, so mean prediction scores well; R² was below zero for every model.

Reported as of: 2026-10-16

14.46
7ResNet34 (Zeynali)

ResNet34 on raw 1 s PPG (Zeynali et al. 2025 method) [reproduction]

Evaluation details

Trained on all VitalDB data, tested on the 67 MUST (Kermani) recordings (Supraja et al. 2026 out-of-distribution test). MUST glucose spans only 88-183 mg/dL, so mean prediction scores well; R² was below zero for every model.

Reported as of: 2026-10-16

14.99
8VGG16-1s

VGG16, 1 s segments (Zeynali et al. 2025)

Evaluation details

Original paper: trained on VitalDB (random 70/15/15 split), external test on the MUST (Kermani) dataset with 1 s peak-centred segments resampled to 100 Hz (Tables 6-7).

Reported as of: 2026-10-16

15
91D-CNN (Alghlayini)

1D-CNN on raw PPG (Alghlayini et al. 2023 method) [reproduction]

Evaluation details

Trained on all VitalDB data, tested on the 67 MUST (Kermani) recordings (Supraja et al. 2026 out-of-distribution test). MUST glucose spans only 88-183 mg/dL, so mean prediction scores well; R² was below zero for every model.

Reported as of: 2026-10-16

16.56

PPG Signals for Blood Glucose Measurement (Kermani / Mendeley): RMSE (mg/dL)

Glucose estimation: PPG Signals for Blood Glucose Measurement (Kermani / Mendeley), Glucose RMSE (mg/dL). Reported rankings; evaluation protocols may differ.
RankMethod & evaluationGlucose RMSE (mg/dL)↓ Lower is better
1ResNet34-1s

ResNet34, 1 s segments (Zeynali et al. 2025)

Evaluation details

Original paper: trained on VitalDB (random 70/15/15 split), external test on the MUST (Kermani) dataset with 1 s peak-centred segments resampled to 100 Hz (Tables 6-7).

Reported as of: 2026-10-16

19.7
2VGG16-1s

VGG16, 1 s segments (Zeynali et al. 2025)

Evaluation details

Original paper: trained on VitalDB (random 70/15/15 split), external test on the MUST (Kermani) dataset with 1 s peak-centred segments resampled to 100 Hz (Tables 6-7).

Reported as of: 2026-10-16

21
3CNN-LSTM-Att-1s

CNN-LSTM-Attention, 1 s segments (Zeynali et al. 2025)

Evaluation details

Original paper: trained on VitalDB (random 70/15/15 split), external test on the MUST (Kermani) dataset with 1 s peak-centred segments resampled to 100 Hz (Tables 6-7).

Reported as of: 2026-10-16

24.4

VitalDB: Clarke zone A

Glucose estimation: VitalDB, Clarke error grid zone A (%). Reported rankings; evaluation protocols may differ.
RankMethod & evaluationClarke error grid zone A (%)↑ Higher is better
1ResNet34 (Zeynali)

ResNet34 on raw 1 s PPG (Zeynali et al. 2025 method)

Evaluation details

Reproduced by Supraja et al. 2026 on VitalDB intraoperative finger PPG vs lab glucose; leave-some-participants-out (test = 1/5 of participants, non-overlapping), mean of 5 folds. A predict-the-training-mean baseline scores within ~1 mg/dL of every model.

Reported as of: 2026-10-16

55.62
2MFCC + XGBoost (Prabha)

MFCC features + XGBoost (Prabha et al. 2022 method)

Evaluation details

Reproduced by Supraja et al. 2026 on VitalDB intraoperative finger PPG vs lab glucose; leave-some-participants-out (test = 1/5 of participants, non-overlapping), mean of 5 folds. A predict-the-training-mean baseline scores within ~1 mg/dL of every model.

Reported as of: 2026-10-16

55.1
31D-CNN (Alghlayini)

1D-CNN on raw PPG (Alghlayini et al. 2023 method)

Evaluation details

Reproduced by Supraja et al. 2026 on VitalDB intraoperative finger PPG vs lab glucose; leave-some-participants-out (test = 1/5 of participants, non-overlapping), mean of 5 folds. A predict-the-training-mean baseline scores within ~1 mg/dL of every model.

Reported as of: 2026-10-16

54.19
4XGBoost (Gupta)

PPG features + XGBoost (Gupta et al. 2021 method)

Evaluation details

Reproduced by Supraja et al. 2026 on VitalDB intraoperative finger PPG vs lab glucose; leave-some-participants-out (test = 1/5 of participants, non-overlapping), mean of 5 folds. A predict-the-training-mean baseline scores within ~1 mg/dL of every model.

Reported as of: 2026-10-16

53.88
5PLS (Islam)

PPG features + partial least squares (Islam et al. 2021 method)

Evaluation details

Reproduced by Supraja et al. 2026 on VitalDB intraoperative finger PPG vs lab glucose; leave-some-participants-out (test = 1/5 of participants, non-overlapping), mean of 5 folds. A predict-the-training-mean baseline scores within ~1 mg/dL of every model.

Reported as of: 2026-10-16

53.19
6Mean baseline

Mean-of-training-set baseline

Evaluation details

Reproduced by Supraja et al. 2026 on VitalDB intraoperative finger PPG vs lab glucose; leave-some-participants-out (test = 1/5 of participants, non-overlapping), mean of 5 folds. A predict-the-training-mean baseline scores within ~1 mg/dL of every model.

Reported as of: 2026-10-16

52.27

VitalDB: MAE (mg/dL)

Glucose estimation: VitalDB, Glucose MAE (mg/dL). Reported rankings; evaluation protocols may differ.
RankMethod & evaluationGlucose MAE (mg/dL)↓ Lower is better
1MFCC + XGBoost (Prabha)

MFCC features + XGBoost (Prabha et al. 2022 method)

Evaluation details

Reproduced by Supraja et al. 2026 on VitalDB intraoperative finger PPG vs lab glucose; leave-some-participants-out (test = 1/5 of participants, non-overlapping), mean of 5 folds. A predict-the-training-mean baseline scores within ~1 mg/dL of every model.

Reported as of: 2026-10-16

25.42
2XGBoost (Gupta)

PPG features + XGBoost (Gupta et al. 2021 method)

Evaluation details

Reproduced by Supraja et al. 2026 on VitalDB intraoperative finger PPG vs lab glucose; leave-some-participants-out (test = 1/5 of participants, non-overlapping), mean of 5 folds. A predict-the-training-mean baseline scores within ~1 mg/dL of every model.

Reported as of: 2026-10-16

25.77
3ResNet34 (Zeynali)

ResNet34 on raw 1 s PPG (Zeynali et al. 2025 method)

Evaluation details

Reproduced by Supraja et al. 2026 on VitalDB intraoperative finger PPG vs lab glucose; leave-some-participants-out (test = 1/5 of participants, non-overlapping), mean of 5 folds. A predict-the-training-mean baseline scores within ~1 mg/dL of every model.

Reported as of: 2026-10-16

25.93
41D-CNN (Alghlayini)

1D-CNN on raw PPG (Alghlayini et al. 2023 method)

Evaluation details

Reproduced by Supraja et al. 2026 on VitalDB intraoperative finger PPG vs lab glucose; leave-some-participants-out (test = 1/5 of participants, non-overlapping), mean of 5 folds. A predict-the-training-mean baseline scores within ~1 mg/dL of every model.

Reported as of: 2026-10-16

26.05
5PLS (Islam)

PPG features + partial least squares (Islam et al. 2021 method)

Evaluation details

Reproduced by Supraja et al. 2026 on VitalDB intraoperative finger PPG vs lab glucose; leave-some-participants-out (test = 1/5 of participants, non-overlapping), mean of 5 folds. A predict-the-training-mean baseline scores within ~1 mg/dL of every model.

Reported as of: 2026-10-16

26.14
6Mean baseline

Mean-of-training-set baseline

Evaluation details

Reproduced by Supraja et al. 2026 on VitalDB intraoperative finger PPG vs lab glucose; leave-some-participants-out (test = 1/5 of participants, non-overlapping), mean of 5 folds. A predict-the-training-mean baseline scores within ~1 mg/dL of every model.

Reported as of: 2026-10-16

26.39

VitalDB: MARD

Glucose estimation: VitalDB, MARD (%). Reported rankings; evaluation protocols may differ.
RankMethod & evaluationMARD (%)↓ Lower is better
1MFCC + XGBoost (Prabha)

MFCC features + XGBoost (Prabha et al. 2022 method)

Evaluation details

Reproduced by Supraja et al. 2026 on VitalDB intraoperative finger PPG vs lab glucose; leave-some-participants-out (test = 1/5 of participants, non-overlapping), mean of 5 folds. A predict-the-training-mean baseline scores within ~1 mg/dL of every model.

Reported as of: 2026-10-16

21.56
21D-CNN (Alghlayini)

1D-CNN on raw PPG (Alghlayini et al. 2023 method)

Evaluation details

Reproduced by Supraja et al. 2026 on VitalDB intraoperative finger PPG vs lab glucose; leave-some-participants-out (test = 1/5 of participants, non-overlapping), mean of 5 folds. A predict-the-training-mean baseline scores within ~1 mg/dL of every model.

Reported as of: 2026-10-16

21.8
3XGBoost (Gupta)

PPG features + XGBoost (Gupta et al. 2021 method)

Evaluation details

Reproduced by Supraja et al. 2026 on VitalDB intraoperative finger PPG vs lab glucose; leave-some-participants-out (test = 1/5 of participants, non-overlapping), mean of 5 folds. A predict-the-training-mean baseline scores within ~1 mg/dL of every model.

Reported as of: 2026-10-16

21.96
4PLS (Islam)

PPG features + partial least squares (Islam et al. 2021 method)

Evaluation details

Reproduced by Supraja et al. 2026 on VitalDB intraoperative finger PPG vs lab glucose; leave-some-participants-out (test = 1/5 of participants, non-overlapping), mean of 5 folds. A predict-the-training-mean baseline scores within ~1 mg/dL of every model.

Reported as of: 2026-10-16

22.28
5Mean baseline

Mean-of-training-set baseline

Evaluation details

Reproduced by Supraja et al. 2026 on VitalDB intraoperative finger PPG vs lab glucose; leave-some-participants-out (test = 1/5 of participants, non-overlapping), mean of 5 folds. A predict-the-training-mean baseline scores within ~1 mg/dL of every model.

Reported as of: 2026-10-16

22.52
6ResNet34 (Zeynali)

ResNet34 on raw 1 s PPG (Zeynali et al. 2025 method)

Evaluation details

Reproduced by Supraja et al. 2026 on VitalDB intraoperative finger PPG vs lab glucose; leave-some-participants-out (test = 1/5 of participants, non-overlapping), mean of 5 folds. A predict-the-training-mean baseline scores within ~1 mg/dL of every model.

Reported as of: 2026-10-16

22.55