What is vascular age? What smartwatch pulse-wave studies show
Vascular age compares your arteries with your birthday. A plain-language definition, normal PWV by age, and what a 165,549-user smartwatch study found.
- Wearable Accuracy
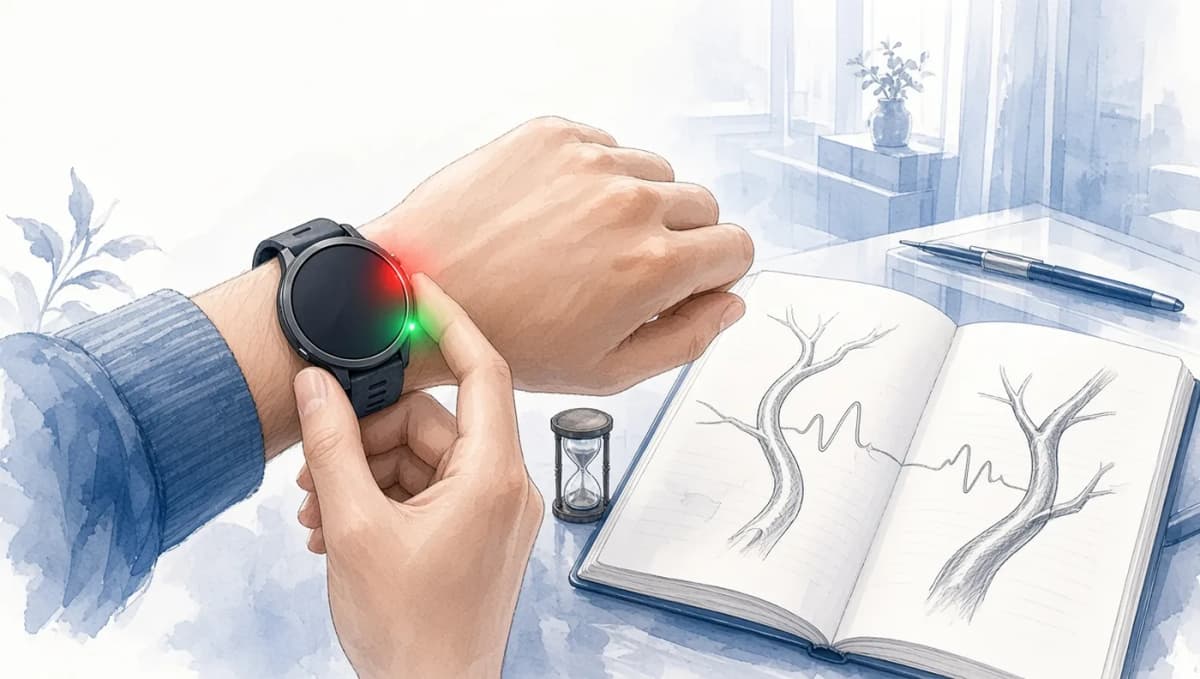
Short answer: Vascular age is the apparent age of your arteries, as opposed to your chronological age, the years since you were born. It is usually estimated from pulse wave velocity (PWV), the speed of the pressure pulse along your large arteries. Stiffer arteries carry the pulse faster, so a PWV that is typical of an older age group means an older vascular age.
Clinics measure PWV between the neck and the groin with dedicated equipment. Smart scales and some smartwatches now offer their own estimates, and the largest study so far, 165,549 Huawei watch users in China, shows both what the wrist version can do and where it falls short.
This article is educational and is not medical advice. Talk with a clinician about your cardiovascular risk.
Arteries vs birthday: the definition
Blood vessels change as we get older. The large arteries become stiffer and wider, and the first part of the aorta gets longer. Charlton and colleagues describe this process as vascular aging. They define vascular age as the apparent age of the blood vessels, set against chronological age, meaning the time since birth (Charlton et al., 2022, doi:10.1152/ajpheart.00392.2021). The same review notes that indicators of vascular aging, such as aortic stiffness measured by carotid-femoral PWV, predict cardiovascular disease and death from any cause.
Two people born in the same year can have very different arteries, and chronological age cannot tell them apart while a stiffness measurement can. If you are 45 and your arteries behave like those of a typical 60-year-old, your vascular age is older than your birthday suggests.
For the physiology of why stiff arteries speed up the pulse, see our explainer on what pulse wave velocity is and the shorter PWV glossary entry.
How PWV becomes a "vascular age"
PWV is distance divided by time. In the clinic, a technician records the pulse at the carotid artery in the neck and the femoral artery in the groin, measures the distance between the two sites, and divides by the delay. That carotid-femoral PWV (cfPWV) is the standard reference for aortic stiffness.
Turning a PWV into an age needs a reference table: what PWV looks like at each age in healthy people. The best-known European table comes from the Reference Values for Arterial Stiffness' Collaboration, which pooled 16,867 people from 13 centres in eight countries (Reference Values for Arterial Stiffness' Collaboration, 2010, doi:10.1093/eurheartj/ehq165). After standardizing the different devices, it found that PWV rose with age and with blood pressure, and that the rise with age was steeper at higher blood pressure. Its "normal values" come from 1,455 people without cardiovascular risk factors and with optimal or normal blood pressure.
Scroll horizontally if needed
| Age (years) | Median cfPWV, m/s | 10th–90th percentile, m/s |
|---|---|---|
| Under 30 | 6.1 | 5.3–7.1 |
| 30–39 | 6.4 | 5.2–8.0 |
| 40–49 | 6.9 | 5.9–8.6 |
| 50–59 | 8.1 | 6.3–10.0 |
| 60–69 | 9.7 | 7.9–13.1 |
| 70 and older | 10.6 | 8.0–14.6 |
Source: Reference Values for Arterial Stiffness' Collaboration (2010), Table 4, normal-value population.
A vascular age is, at heart, a lookup: find the age group whose typical PWV matches yours. A cfPWV of 8.1 m/s is the median for people in their 50s in this table. Commercial products layer their own algorithms and user data on top, but the logic is the same. It also means the answer depends on which reference group you are compared against.
What a 165,549-user smartwatch study showed
Wang and colleagues analysed every adult who took a valid PWV reading on one of four Huawei watches between December 2020 and August 2022, across 34 provinces in China (Wang et al., 2026, doi:10.3389/fcvm.2026.1865667). After data cleaning, 165,549 users remained. They were 88% men, with an average age of about 42, and a median smartwatch PWV (SW-PWV) of 7.79 m/s.
How the watch estimates PWV
The watch cannot reach your carotid or femoral artery. Instead, you sit quietly for 10 minutes, wear the watch on your left wrist, and touch it with your right index finger for 30 seconds, so the watch can record an ECG while its optical sensor records a PPG pulse at the wrist. The algorithm times the gap from the ECG R wave to the foot of the PPG pulse:
where is when the foot of the wrist pulse arrives, is the time of the R-wave peak, and is an effective arterial path length that the watch estimates from body measurements. The paper calls the interval pulse transit time; reviews of PPG methods file ECG-to-PPG timing under pulse arrival time (Charlton et al., 2022, doi:10.1152/ajpheart.00392.2021). The pulse transit time entry covers the difference.
Two details matter for interpretation. First, the algorithm also folds in age, sex and BMI and is calibrated to earlier validation data. Second, the investigators did not have access to the source code. The output is a proprietary estimate of cfPWV, not a direct measurement.
How close is it? In an earlier validation, 347 volunteers aged 18 to 80 had cfPWV measured by both the watch and a Complior Analyse device. Agreement was good: a concordance correlation coefficient of 0.9045, mean absolute error of 0.66 m/s, and 95% limits of agreement from −1.77 to 1.86 m/s (as summarized by Wang et al., 2026, doi:10.3389/fcvm.2026.1865667).
Limits that wide mean a single reading can sit almost 2 m/s from the clinical value. That is more than the step between neighbouring age groups in the table above, such as 8.1 m/s in the 50s and 9.7 m/s in the 60s.
Readings by age
SW-PWV correlated with age (r = 0.63). The median rose from 7.33 m/s in users under 30 to 11.28 m/s in those 70 and older, with a jump between the 40s (7.66 m/s) and the 50s (8.96 m/s). Under 60, women had lower values than men. From 60 onward the sexes were similar. A regression on age, sex and BMI alone explained 60.9% of the variation in readings.
Because age, sex and BMI are inputs to the algorithm, the authors caution that these patterns describe the algorithm's output and are not independent evidence about biology. In the chart below, the smartwatch bars are far narrower than the clinical ones. The bars use different percentile ranges, so treat that as a rough comparison.
Pulse wave velocity by age: clinic reference vs smartwatch estimate
Pick an age group, or type a PWV value to see which age group's median it sits closest to. That matching step is the basic idea behind a "vascular age".
Ages 50–59: clinical carotid-femoral PWV in healthy European adults had a median of 8.1 m/s (10th–90th percentile 6.3–10). The smartwatch estimate for all users in China had a median of 8.96 m/s (interquartile range 8.33–9.32, n = 27,697).
What it shows: both datasets climb with age, with the biggest steps from the 50s onward. The smartwatch bars look narrower partly because they cover the middle 50% of users rather than the middle 80%, and partly because the watch algorithm uses age, sex and BMI as inputs, which its authors say makes the age pattern partly a property of the algorithm. The populations and methods differ too, so compare the shapes rather than exact values.
Data table
| Age | Clinical cfPWV median (10th–90th) | Smartwatch, all users: median (IQR) | Smartwatch n |
|---|---|---|---|
| <30 | 6.1 (5.3–7.1) | 7.33 (7.17–7.64) | 24,879 |
| 30–39 | 6.4 (5.2–8) | 7.6 (7.43–7.96) | 52,905 |
| 40–49 | 6.9 (5.9–8.6) | 7.66 (7.49–8.06) | 48,015 |
| 50–59 | 8.1 (6.3–10) | 8.96 (8.33–9.32) | 27,697 |
| 60–69 | 9.7 (7.9–13.1) | 9.77 (9.22–10.29) | 8,626 |
| ≥70 | 10.6 (8–14.6) | 11.28 (10.7–11.98) | 3,427 |
Readings and cardiovascular disease
In all, 35,402 users also filled in a health questionnaire in the companion app. Readings were higher in people who reported hypertension, diabetes, high cholesterol, coronary heart disease, stroke or carotid plaque, with hypertension and carotid plaque showing the strongest links. In the group reading 10 m/s or more, 54.43% reported no cardiovascular disease, against 84.76% of the group below 10 m/s.
As a screening test for existing cardiovascular disease, SW-PWV had an area under the curve of 0.71, which the authors call moderate discrimination. Within each age group, its ability to pick out people with hypertension was weak, with AUCs between 0.508 and 0.589.
Why the 10 m/s cut-off barely transfers to the wrist
The 2018 European (ESC/ESH) hypertension guidelines use 10 m/s as the cfPWV threshold for arterial stiffness, and Wang and colleagues tried that same cut-off on the watch readings.
Scroll horizontally if needed
| Threshold on SW-PWV | Sensitivity for prevalent CVD | Specificity |
|---|---|---|
| 10 m/s (borrowed from clinical cfPWV) | 13.6% | 96.7% |
| 8.53 m/s (best fit in this dataset) | 56.5% | 76.9% |
Source: Wang et al. (2026), ROC analysis in the 35,402-user questionnaire subgroup.
At 10 m/s, the watch rarely flagged people without disease, but it missed about 86 of every 100 people who reported having it. The cut-off that balanced the two best in this dataset was 8.53 m/s, and that is exploratory: it has not been tested in another population. The authors conclude that 10 m/s might serve only as a "preliminary or exploratory threshold reference" until the watch is validated directly against cfPWV and followed over time.
The study has other limits the authors list themselves. Disease was self-reported and unverified. Blood pressure, medication and smoking were not collected, so the associations are unadjusted. Most users were men who owned a particular brand of watch. Only the first valid reading per person was used, so repeatability is unknown. And the design was cross-sectional, so it says nothing yet about who goes on to have a heart attack or stroke.
Consumer vascular age scores and what they claim
The watch in this study reports a PWV-style number. Withings goes a step further on some smart scales and turns PWV into a vascular age. Its support page describes vascular age as "a relative indicator based on Withings users" that "can't predict an absolute risk of developing a cardiovascular disease and should only be considered as a wellness indicator" (Withings support). The same page explains that its PWV ranges come from the published clinical literature while vascular age is compared with other Withings users, so the two ranges do not line up exactly, and that PWV on the Body Scan is only offered on scales bought in Europe.
In general, a consumer vascular age is a comparison against the company's own reference group, built on its own measurement method. It can be useful for tracking your own trend under consistent conditions. It is not interchangeable with a clinic's cfPWV, and a score from one device does not carry over to another.
Researchers are also trying to read vascular age from the shape of a single PPG pulse, without an ECG. Charlton and colleagues group these approaches into single-PPG pulse wave analysis, multi-site PPG timing, and PPG combined with other signals, and note that PPG is not yet widely used for this purpose (Charlton et al., 2022, doi:10.1152/ajpheart.00392.2021). Our deeper guides cover PPG-based vascular age assessment, the vascular age estimation algorithm, PPG morphology, and how PWV is measured in practice. The review itself has a record in the ChatPPG research hub, and the full research hub tracks newer PPG papers.
What to do with a vascular age number
A high reading is a reason to check blood pressure, cholesterol and blood sugar with a clinician. Hypertension was one of the two conditions most strongly linked to watch PWV in the Wang study, and our hypertension guide explains how it is diagnosed.
Measure the same way each time. The watch protocol asks for 10 minutes of seated rest, a snug strap and a quiet, temperature-controlled room, and the authors note that strap tightness and skin and room temperature may have affected readings taken at home.
Follow trends on one device. Comparing a scale's vascular age with a watch's PWV, or either with a clinic number, mixes different methods and reference groups.
A young-looking number is also no guarantee. At the borrowed 10 m/s cut-off, the watch missed most people who reported cardiovascular disease.
Smartwatch hypertension features raise similar questions about what a wrist signal can and cannot tell you; see our piece on Apple Watch hypertension notifications.
References
- Wang L, Sun N, Wang H, et al. Evaluation of cardiovascular risk using smartwatch-measured pulse wave velocity in China: a nationwide cross-sectional study. Frontiers in Cardiovascular Medicine. 2026;13:1865667. doi:10.3389/fcvm.2026.1865667
- Charlton PH, Paliakaitė B, Pilt K, et al. Assessing hemodynamics from the photoplethysmogram to gain insights into vascular age: a review from VascAgeNet. American Journal of Physiology-Heart and Circulatory Physiology. 2022;322(4):H493-H522. doi:10.1152/ajpheart.00392.2021
- Reference Values for Arterial Stiffness' Collaboration. Determinants of pulse wave velocity in healthy people and in the presence of cardiovascular risk factors: 'establishing normal and reference values'. European Heart Journal. 2010;31(19):2338-2350. doi:10.1093/eurheartj/ehq165
- Withings Support. Body Scan - Vascular Age and Pulse Wave Velocity. https://support.withings.com/hc/en-us/articles/10267301958545-Body-Scan-Vascular-Age-and-Pulse-Wave-Velocity (accessed 2026-10-20).
Frequently Asked Questions
- What is vascular age compared with chronological age?
- Chronological age is the time since you were born. Vascular age is the apparent age of your blood vessels, usually judged from how stiff your large arteries are compared with what is typical for people of each age. If your arteries look like those of an older group, your vascular age is higher than your chronological age.
- Is vascular age the same as pulse wave velocity?
- No. Pulse wave velocity (PWV) is the measurement: how fast the pressure pulse travels along the arteries, in metres per second. Vascular age is an interpretation of that number, made by comparing it with reference values for different age groups. Different companies and studies use different reference groups, so the same PWV can map to different vascular ages.
- Can a smartwatch measure vascular age accurately?
- Not in the clinical sense yet. A Huawei watch estimate agreed well with a clinical device in a 347-person validation study (mean absolute error 0.66 m/s). In a 2026 study of 165,549 users, the estimate separated people with and without self-reported cardiovascular disease only moderately (AUC 0.71), and the clinical 10 m/s cut-off caught 13.6% of people with disease. The algorithm also uses age, sex and BMI as inputs.
- What is a normal pulse wave velocity?
- It depends on age. In a European reference study of 1,455 healthy adults with normal blood pressure, median carotid-femoral PWV was 6.1 m/s under age 30 and 10.6 m/s at 70 and older. European hypertension guidelines use 10 m/s as a cfPWV threshold for arterial stiffness. Smartwatch and smart-scale values are estimates on their own scales and do not map one-to-one onto these clinical numbers.
- Does a high vascular age mean I have heart disease?
- No. Vascular age is a risk marker, not a diagnosis. In the 2026 smartwatch study, 54% of users with a reading of 10 m/s or more reported no cardiovascular disease. A high consumer score is a reason to talk with a clinician about blood pressure, cholesterol and other risk factors, not a reason to panic. This article is educational and is not medical advice.
Related articles
What Is Pulse Wave Velocity? Normal Ranges, Clinical Thresholds, and PPG Estimation
Plain-language explanation of pulse wave velocity, normal ranges by age, clinical risk thresholds, and how PPG wearables estimate PWV from pulse transit time.
Wearable SpO2 Accuracy: What Studies Show
How accurate are smartwatch and ring SpO2 readings? Apple Watch, Fitbit, Garmin, Samsung and Oura compared with clinical pulse oximeters in studies.
How accurate are Apple Watch calories? What 6 studies show
Apple Watch calorie counts usually miss lab measurements by about 15–25%. What six validation studies found, and why body fat changed the error.
Overnight Oximetry vs Sleep Study: What Oximetry Can Show, What It Misses, and Why False Reassurance Happens
Overnight oximetry can be useful for screening and triage, but it is not a full sleep study. This guide explains what oximetry measures, where it fits clinically, and why normal results can still miss meaningful sleep apnea.
PPG Medical Meaning: What PPG Means in Clinical Practice
PPG in medical contexts means photoplethysmography — the optical technique used in pulse oximeters, hospital monitors, and wearables. Learn what it measures, what it shows clinicians, and how it is used.
Devices in this article
Research records with the datasets, papers and published validation results for each device.