Pulse Wave Velocity Measurement Methods: Equipment, Protocols, and PPG-Based Approaches
Compare pulse wave velocity measurement methods including carotid-femoral, brachial-ankle, and PPG-based PWV with equipment, accuracy, and protocol details.
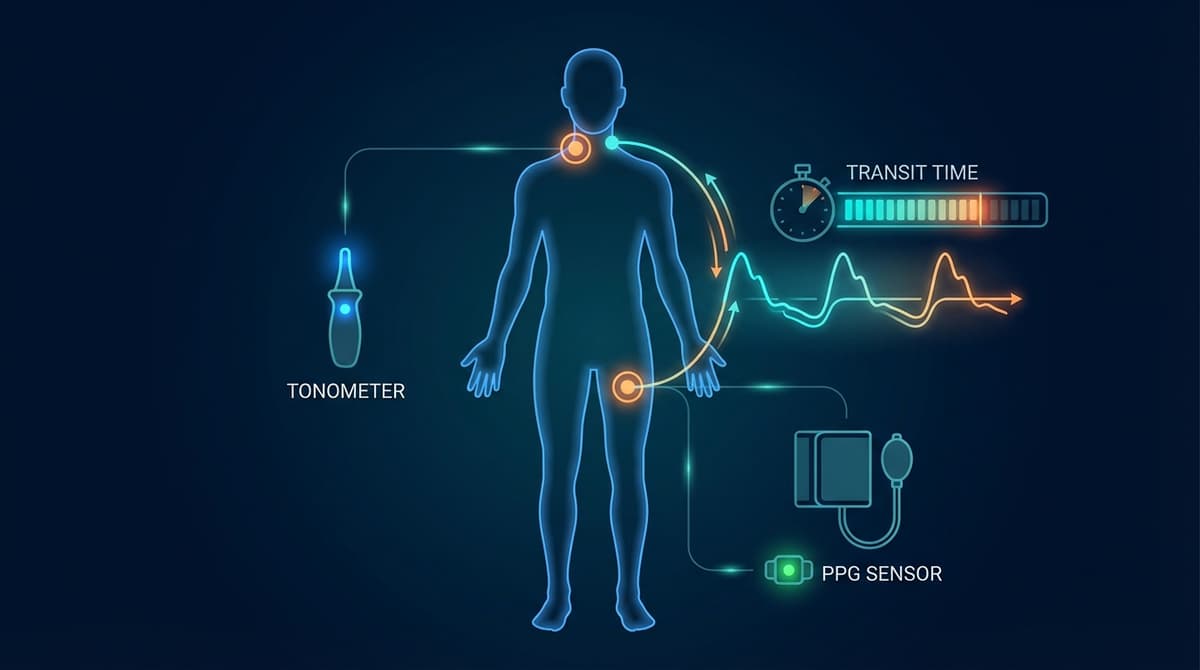
Pulse wave velocity (PWV) measurement quantifies how fast the arterial pressure wave travels through the vascular system, providing a direct index of arterial stiffness. The gold standard is carotid-femoral PWV (cfPWV), which measures the speed of the pressure wave through the aorta between the common carotid and femoral arteries. Normal cfPWV ranges from 6 to 8 m/s in young healthy adults and increases to 10-14 m/s with aging and cardiovascular disease. A cfPWV above 10 m/s is an independent predictor of cardiovascular events and all-cause mortality, recognized in the 2018 ESC/ESH hypertension guidelines as a marker of hypertension-mediated organ damage. Multiple measurement methods exist, ranging from dedicated tonometry systems like SphygmoCor and Complior to emerging PPG-based approaches that estimate PWV using wearable sensors.
The basic principle behind all PWV methods is the same: measure the time it takes for the pulse wave to travel a known distance, then divide distance by time. The differences lie in which arterial segments are assessed, how transit time is detected, and how the path distance is estimated. These methodological choices have profound effects on the resulting values, their reproducibility, and their clinical interpretation.
Carotid-Femoral PWV: The Gold Standard
Carotid-femoral PWV measures the transit time of the pressure wave through the aorta and iliac arteries, the segment most relevant to cardiovascular risk prediction.
Measurement Principle
Two pressure sensors are placed simultaneously on the skin over the common carotid artery (in the neck) and the common femoral artery (in the groin). Each sensor records the local pressure waveform. The time delay between corresponding fiducial points on the two waveforms (typically the foot of the wave, identified by the intersecting tangent method) gives the transit time. The surface distance between the two measurement sites is measured with a tape measure, and PWV is calculated as:
PWV = distance / transit time
Equipment
SphygmoCor (AtCor Medical). Uses sequential ECG-gated applanation tonometry. A single tonometer is applied first to the carotid artery, then to the femoral artery, with simultaneous ECG recording. The ECG R-peak serves as a timing reference to align the two sequentially recorded waveforms and calculate transit time. SphygmoCor also performs central blood pressure estimation and augmentation index analysis using a generalized transfer function.
Complior (ALAM Medical). Uses two piezoelectric mechanotransducers applied simultaneously to the carotid and femoral sites. Simultaneous acquisition eliminates the need for ECG gating and reduces the influence of heart rate variability on transit time estimates. Complior provides a more direct transit time measurement but requires a trained operator to obtain stable signals from both sites simultaneously.
Mobil-O-Graph (IEM). An oscillometric brachial blood pressure cuff that estimates aortic PWV using a mathematical model (ARCSolver algorithm) rather than direct measurement of carotid and femoral pulse waves. It applies pulse wave analysis to the oscillometric waveform and uses age, blood pressure, and waveform features to estimate cfPWV. Convenience is high, but the measurement is modeled rather than directly measured, which introduces additional uncertainty.
Accuracy and Reproducibility
SphygmoCor and Complior produce cfPWV values with intra-observer coefficients of variation of 5-8% and inter-observer CVs of 8-12%. Both devices are recommended by the ARTERY Society consensus document on standardized PWV measurement (Van Bortel et al., 2012, DOI: 10.1093/eurheartj/ehs233).
Distance Measurement: An Underappreciated Source of Error
The surface distance between carotid and femoral sites does not exactly correspond to the true arterial path length. The aorta follows a curved path through the thorax and abdomen, and the carotid artery extends superiorly from the aortic arch while the femoral artery is accessed inferiorly.
Three distance estimation methods are in common use:
- Direct distance: Straight line from carotid to femoral sensor site. Overestimates the true arterial path by 15-25%.
- Subtracted distance: Femoral-to-sternal-notch distance minus carotid-to-sternal-notch distance. This attempts to account for the opposing directions of the two paths. It tends to underestimate the true path.
- 80% of direct distance: The ARTERY Society recommends using 80% of the direct carotid-to-femoral distance as the best approximation of the true aortic path length. This correction was derived from MRI studies comparing surface distance to true arterial path length.
Using different distance methods on the same patient can change the PWV result by 1-2 m/s, which is clinically significant given that the threshold for increased risk is 10 m/s.
Brachial-Ankle PWV (baPWV)
Brachial-ankle PWV measures the transit time from the brachial artery (upper arm) to the posterior tibial artery (ankle) using blood pressure cuffs at both sites.
How It Works
Oscillometric cuffs on the upper arm and ankle simultaneously capture pulse waveforms. The time delay between the feet of the brachial and ankle waveforms gives the transit time. The path distance is estimated from body height using regression equations (distance = 0.5934 x height + 14.4).
Equipment
VP-1000 and VP-2000 (Omron Colin / Fukuda Denshi). These dedicated baPWV devices are widely used in Japan and increasingly in other Asian countries. They simultaneously measure blood pressure and baPWV from four limb cuffs. The measurement takes approximately 5 minutes and requires minimal operator skill.
Comparison with cfPWV
baPWV and cfPWV are correlated (r = 0.70-0.80) but not interchangeable. baPWV measures a longer, more heterogeneous arterial segment that includes both elastic (aorta) and muscular (brachial, femoral, tibial) arteries. Because muscular arteries are inherently stiffer than elastic arteries, baPWV values are higher than cfPWV values in the same individual (typically baPWV = 1.2-1.5 x cfPWV).
baPWV has been validated as a cardiovascular risk predictor in large Asian cohort studies. A meta-analysis by Vlachopoulos et al. (2015) found that baPWV predicted cardiovascular events with a relative risk of 1.19 per 1 m/s increase, comparable to cfPWV (RR 1.15 per 1 m/s) (DOI: 10.1016/j.jacc.2015.08.034).
Advantages of baPWV: Easier to perform (cuffs only, no tonometry), lower operator dependence, simultaneous blood pressure measurement.
Disadvantages: Includes muscular arteries, less specific to aortic stiffness, height-based distance estimation introduces error in patients with unusual body proportions.
Finger-Toe PWV and Other Segment Methods
Less common methods measure PWV over alternative arterial segments:
Finger-to-toe PWV uses PPG sensors on the finger and toe simultaneously. Transit time is measured between the foot of the finger PPG and the foot of the toe PPG. This method is non-invasive and uses inexpensive sensors, but the arterial path is long and heterogeneous, and distance estimation is imprecise.
Carotid-radial PWV measures the transit time through the upper limb arterial tree (primarily muscular arteries). It reflects brachial artery stiffness rather than aortic stiffness and is less predictive of cardiovascular events than cfPWV.
Heart-to-finger PWV (PAT-based) uses the ECG R-peak to finger PPG interval (pulse arrival time, PAT) as a surrogate for aortic-to-peripheral transit time. PAT includes the pre-ejection period (PEP), which adds noise because PEP varies with cardiac contractility independently of arterial stiffness. Despite this limitation, PAT-based PWV is the easiest method to implement with consumer wearables.
PPG-Based PWV Estimation: From Lab to Wrist
PPG-based approaches aim to estimate PWV without dedicated tonometry equipment, using sensors already present in wearable devices.
Dual-Site PPG Methods
Using two PPG sensors at different body locations (such as finger and earlobe, or finger and toe), transit time is measured directly from the time delay between the two PPG waveforms. This is the most direct PPG-based approach and avoids PEP contamination.
Ding et al. (2017) demonstrated ear-to-finger PPG transit time measurement with correlation of r = 0.78 to cfPWV in 30 healthy subjects. The practical limitation is obvious: requiring PPG sensors at two separate body sites defeats the convenience advantage of wearables. However, multi-sensor form factors (earbuds plus smartwatch, for example) may enable this approach in consumer products.
Single-Site PPG Methods (PTT-Free)
Single-site PPG methods extract PWV-related information from the morphology of a single PPG waveform, without measuring transit time between two sites.
Stiffness index (SI): As described above, SI = height / delta_T uses the time delay between the systolic peak and the reflected wave component within a single pulse to estimate round-trip transit time to the aortic bifurcation. SI correlates with cfPWV (r = 0.65) and requires only a single finger PPG sensor.
SDPPG aging index: The second derivative of the PPG provides indices that correlate with arterial stiffness and, indirectly, with PWV. The b/a ratio and composite aging index track age-dependent arterial stiffening.
Machine learning from PPG morphology: Deep learning models trained on large datasets of simultaneous PPG and reference PWV measurements can estimate PWV from raw PPG waveform features without explicit feature extraction. Reported accuracies in validation studies range from r = 0.70-0.85 against cfPWV, though generalizability to new populations remains unproven.
For a comprehensive overview of PPG-derived PWV, see our PPG pulse wave velocity guide.
ECG-PPG (PAT-Based) Methods
The most accessible wearable approach uses the ECG R-peak to PPG foot interval (PAT) measured from a smartwatch with both ECG and PPG sensors.
PWV_PAT = estimated_distance / PAT
Where estimated distance is typically derived from body height. This approach is used in several commercial devices and research platforms.
Limitations:
- PAT includes PEP (typically 40-80 ms), which varies with cardiac contractility
- The arterial path from heart to wrist (or finger) includes both elastic and muscular segments
- Distance estimation from height is approximate
- Correlation with cfPWV is moderate (r = 0.55-0.70)
Correction for PEP can be attempted using impedance cardiography (ICG) or seismocardiography (SCG), but these additional sensors add complexity.
Accuracy Comparison Across Methods
| Method | Reference Correlation (vs cfPWV) | Typical CV (%) | Operator Skill | Equipment Cost |
|---|---|---|---|---|
| Carotid-femoral (SphygmoCor) | Reference standard | 5-8 | High | $15,000-25,000 |
| Carotid-femoral (Complior) | Reference standard | 6-9 | High | $15,000-20,000 |
| Oscillometric (Mobil-O-Graph) | r = 0.70-0.80 | 10-15 | Low | $3,000-5,000 |
| Brachial-ankle (VP-1000) | r = 0.70-0.80 | 8-12 | Low-Moderate | $10,000-15,000 |
| Dual-site PPG (ear-finger) | r = 0.70-0.78 | 10-18 | Low | $50-200 |
| Single-site PPG (SI) | r = 0.60-0.65 | 12-20 | Low | $20-100 |
| ECG-PPG (PAT-based) | r = 0.55-0.70 | 15-25 | Low | $200-500 |
Protocol Standardization: ARTERY Society Guidelines
The ARTERY Society published consensus guidelines for cfPWV measurement that address the major sources of variability (Van Bortel et al., 2012):
Patient preparation:
- Supine rest for at least 10 minutes before measurement
- No caffeine, food, or smoking for at least 3 hours
- Temperature-controlled room (22-24 degrees Celsius)
- Empty bladder
Measurement protocol:
- Record at least two complete measurements (10+ cardiac cycles each)
- Use 80% of the direct carotid-to-femoral distance
- Report the mean of at least two measurements within 0.5 m/s of each other
- Record simultaneous blood pressure (cfPWV is blood pressure-dependent)
- Document heart rate (for studies comparing across conditions)
Quality control:
- Inspect waveforms visually for artifact
- Reject measurements with standard deviation of transit time > 10% of the mean
- Report the operator and the device used
These guidelines were developed for cfPWV using tonometry, but analogous standardization is needed for PPG-based methods. Currently, no consensus protocol exists for PPG-derived PWV measurement, which contributes to the wide variability in reported accuracies across studies.
For an understanding of how PTT relates to blood pressure estimation, see our PPG pulse transit time and blood pressure guide. Additional context on arterial stiffness as a cardiovascular biomarker is available in our PPG aortic stiffness biomarker guide.
Clinical Interpretation of PWV Values
The clinical significance of PWV depends on the method used, the patient's age, and their blood pressure.
Age-specific reference values for cfPWV (from the Reference Values for Arterial Stiffness Collaboration):
| Age (years) | Normal cfPWV (m/s) | Elevated Risk Threshold |
|---|---|---|
| < 30 | 6.2 +/- 0.8 | > 7.5 |
| 30-39 | 6.5 +/- 1.0 | > 8.0 |
| 40-49 | 7.2 +/- 1.2 | > 9.0 |
| 50-59 | 8.3 +/- 1.5 | > 10.0 |
| 60-69 | 10.3 +/- 2.0 | > 12.0 |
| > 70 | 11.5 +/- 2.5 | > 14.0 |
The ESC/ESH guidelines use a cfPWV threshold of 10 m/s as an indicator of hypertension-mediated organ damage, independent of age. Values above this threshold are associated with a 1.5 to 2-fold increase in cardiovascular event risk.
baPWV reference values are approximately 20-30% higher than cfPWV due to the inclusion of muscular arteries. A baPWV threshold of 14 m/s is commonly used in Asian studies as the cutoff for increased cardiovascular risk.
PPG-derived values should not be directly compared to cfPWV or baPWV reference ranges because the arterial segments and estimation methods differ. Each PPG-based PWV method needs its own validated reference ranges, which are currently lacking for most approaches.
Emerging Directions
Smartphone-based PWV. Using the smartphone camera as a PPG sensor (by placing the fingertip over the camera), researchers have demonstrated PWV estimation from the stiffness index with reasonable accuracy in controlled settings. This approach could enable population-scale arterial stiffness screening with no additional hardware.
Multi-sensor wearable systems. Combining wrist PPG with accelerometer-derived seismocardiography (SCG) allows PEP to be estimated and subtracted from PAT, yielding a cleaner PTT. Early results suggest this improves the PWV-blood pressure correlation from r = 0.55-0.65 (PAT-based) to r = 0.70-0.80 (PTT-based).
Continuous PWV tracking. Rather than single-point measurements, continuous beat-to-beat PWV monitoring from wearables could track arterial stiffness changes during exercise, sleep, and daily activities. This temporal richness may provide additional prognostic value beyond resting PWV.
For context on vascular aging assessment using PPG-derived indices, see our PPG vascular age assessment guide.
Frequently Asked Questions
What is the most accurate way to measure pulse wave velocity?
Carotid-femoral pulse wave velocity measured with SphygmoCor or Complior is the gold standard. These devices use applanation tonometry or piezoelectric sensors to directly record pressure waveforms at the carotid and femoral arteries. The ARTERY Society recommends using 80% of the direct surface distance and reporting the mean of at least two measurements.
Can a smartwatch measure pulse wave velocity?
Smartwatches with both ECG and PPG sensors can estimate pulse arrival time (PAT), which is a surrogate for PWV. However, PAT includes the pre-ejection period and uses a non-aortic arterial path, so the values are not equivalent to cfPWV. Smartwatch PWV estimates have moderate correlation with the gold standard (r = 0.55-0.70) and should not be used for clinical decision-making without further validation.
What is a normal pulse wave velocity?
For cfPWV, normal values in young adults (under 30) are approximately 6-7 m/s. Values increase with age: 7-8 m/s at age 40-49, 8-10 m/s at age 50-59, and 10-12 m/s at age 60-69. The European hypertension guidelines use 10 m/s as the threshold for increased cardiovascular risk, regardless of age.
What is the difference between carotid-femoral and brachial-ankle PWV?
Carotid-femoral PWV measures aortic stiffness specifically, the most clinically relevant segment. Brachial-ankle PWV measures a longer path that includes both elastic (aorta) and muscular (limb) arteries, yielding higher values. Both predict cardiovascular events, but cfPWV is considered the gold standard because the aorta is where stiffness changes have the greatest hemodynamic impact.
How does PPG estimate pulse wave velocity without two measurement points?
Single-site PPG methods estimate PWV indirectly from waveform morphology. The stiffness index uses the time delay between the forward and reflected wave components within a single pulse cycle, combined with body height, to estimate round-trip transit time through the large arteries. Machine learning methods use the entire waveform shape to predict PWV without explicit feature extraction.
Why does PWV increase with age?
Arterial walls contain elastin and collagen fibers. With aging, elastin fibers fragment and degrade, while collagen is deposited in its place. Collagen is 100-1000 times stiffer than elastin. This structural change reduces arterial compliance and increases the speed at which pressure waves propagate. Hypertension, diabetes, and chronic kidney disease accelerate this process beyond normal aging.
How often should pulse wave velocity be measured?
There is no consensus on measurement frequency for clinical use. In research protocols, annual or biennial cfPWV measurements are common for tracking arterial aging. For hypertensive patients, measurement at diagnosis and after treatment changes is recommended by some European guidelines. Wearable devices could eventually enable daily or continuous monitoring, though clinical frameworks for interpreting this data do not yet exist.