Device comparisons
Amazfit vs Garmin: Budget vs Premium PPG Sensor Technology
Amazfit's T-Rex Ultra lists up to 20 days typical battery, 10 ATM water resistance and a BioTracker PPG sensor with blood-oxygen support. Garmin's Forerunner 265 lists up to 13 days and 5 ATM; the Fenix 8 (47 mm AMOLED) up to 16 days and 10 ATM plus 40 m diving. ChatPPG has not verified a peer-reviewed accuracy study of the T-Rex Ultra; Garmin's evidence comes from older models.
Devices
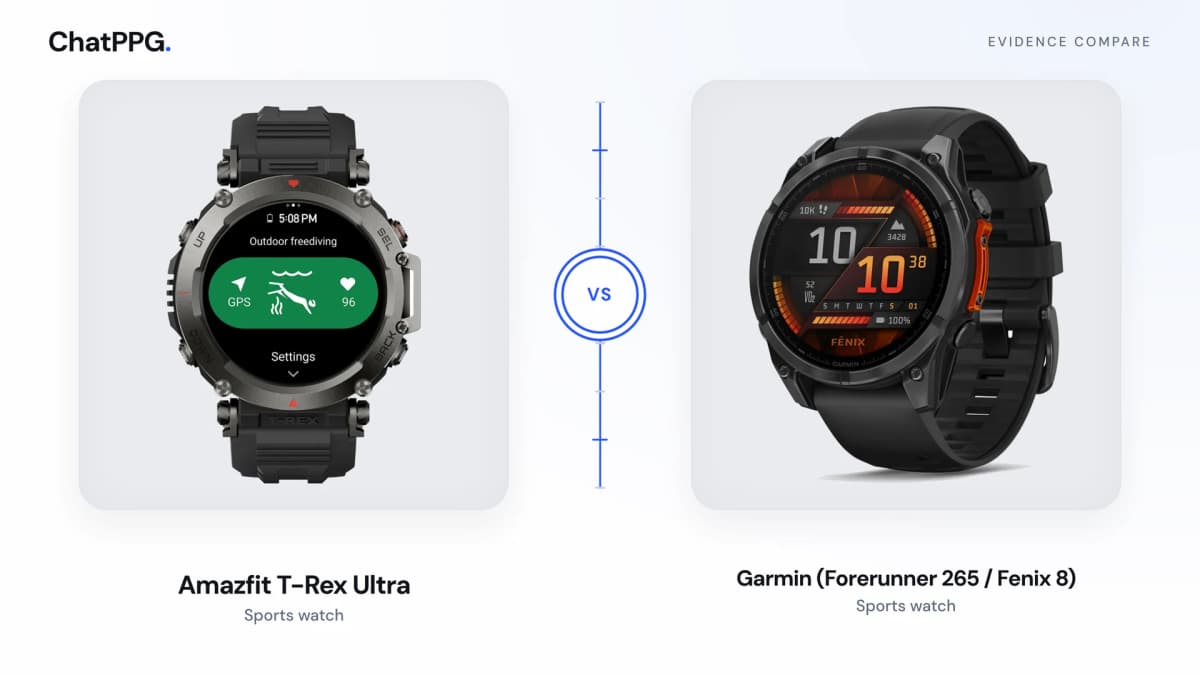
Amazfit T-Rex Ultra
Sports watchDevice guideGarmin (Forerunner 265 / Fenix 8)
Sports watchDevice guideAmazfit T-Rex Ultra: product photograph from Amazfit. This is the original T-Rex Ultra, not T-Rex Ultra 2. Garmin fēnix 8 47 mm AMOLED, slate gray case with a black silicone band (part 010-02904-00): product photograph from Garmin.
At a glance
This page does not list head-to-head accuracy numbers, so the scoreboard shows hardware differences only.
| Specification | Amazfit T-Rex Ultra | Garmin (Forerunner 265 / Fenix 8) |
|---|---|---|
| Optical sensorDiffers | BioTracker PPG (supports blood oxygen) | — |
| Battery LifeDiffers | Up to 20 days typical; up to 9 days heavy use | Up to 13 days (FR265); up to 16 days (Fenix 8 47 mm AMOLED) |
| Water ResistanceDiffers | 10 ATM | 5 ATM (FR265); 10 ATM + 40 m dive (Fenix 8) |
| ECGDiffers | — | Fenix 8: ECG App |
Primary rows only. The study tables further down list more results from the accuracy database.
Hardware specs
| Specification | Amazfit T-Rex Ultra | Garmin (Forerunner 265 / Fenix 8) |
|---|---|---|
| Optical sensorDiffers | BioTracker PPG (supports blood oxygen) | — |
| Battery LifeDiffers | Up to 20 days typical; up to 9 days heavy use | Up to 13 days (FR265); up to 16 days (Fenix 8 47 mm AMOLED) |
| Water ResistanceDiffers | 10 ATM | 5 ATM (FR265); 10 ATM + 40 m dive (Fenix 8) |
| ECGDiffers | — | Fenix 8: ECG App |
Hardware only. Study results are not repeated in this table. Differs marks values that are not the same. An em dash means this page did not publish that figure.
Specs verified on October 17, 2026: Amazfit T-Rex Ultra specifications, Garmin Forerunner 265 owner's manual: battery information, Garmin Forerunner 265 owner's manual: specifications, Garmin Fenix 8 owner's manual: battery information, Garmin Fenix 8 owner's manual: specifications, Garmin: ECG App expands to Australia and the EU (Venu 3, Fenix 8), Gillinov et al. 2017, Med Sci Sports Exerc (exercise HR vs ECG, n=50), Miller et al. 2022, Sensors (six devices vs PSG and ECG, n=53).
Pros and cons
Amazfit T-Rex Ultra
Pros
- Up to 20 days typical battery (25 days battery saver)
- 10 ATM (ISO 22810:2010)
- BioTracker PPG sensor with blood-oxygen support
Cons
- No peer-reviewed T-Rex Ultra validation verified by ChatPPG
Garmin (Forerunner 265 / Fenix 8)
Pros
- Forerunner 235 exercise HR concordance 0.81 vs ECG (Gillinov 2017)
- Fenix 8: ECG App and 40 m dive rating
- HRV Status vs a 3-week baseline
Cons
- FR265 up to 13 days, shorter than T-Rex Ultra's quoted 20
- Forerunner 245 overnight HR ICC 0.41 vs ECG (Miller 2022)
What published studies show
One table per metric. These rows come from the accuracy database and are not repeated as a second card list. From the wearable accuracy database (v1.0.0).
Heart rate at rest1 study
| Device tested | Result | Reference | Sample | Study |
|---|---|---|---|---|
| Garmin Vivoactive 4 | ρc = 0.9998Lin's concordance correlation | ECG | n = 263, 30-min standardised recording | Theurl et al. (2023)Independent |
Heart rate during exercise4 studies
| Device tested | Result | Reference | Sample | Study |
|---|---|---|---|---|
| Amazfit Cor / Bip | Absolute percentage error within 10% at every stageStudy finding (no single number) | 12-lead ECG | n = 51, Incremental treadmill test | Ibrahim et al. (2024)Funding not reported |
| Garmin Vivosmart 5 | Skin pigmentation did not predict error (P = 0.29)Study finding (no single number) | ECG chest strap (Polar H7/ | n = 28, Rest, cycling, recovery | Mulholland et al. (2026)Independent |
| Garmin Fenix 5 | 2.9%–9.2% (range by intensity)Coefficient of variation | ECG chest strap (Polar H7/ | n = 25, Sitting, walking, running, sprints | Düking et al. (2020)Independent |
| Garmin Forerunner 235all exercise conditions | rc = 0.81Lin's concordance correlation | ECG | n = 50, Gillinov: treadmill, bike, elliptical | Gillinov et al. (2017)Funding not reported |
Overnight heart rate1 study
| Device tested | Result | Reference | Sample | Study |
|---|---|---|---|---|
| Garmin Forerunner 245 Music | ICC 0.41Intraclass correlation | ECG | n = 53, Overnight, sleep laboratory | Miller et al. (2022)Other maker funded |
| Garmin Forerunner 245 Music | 5.4 bpm (absolute bias)Mean absolute error | ECG | n = 53, Overnight, sleep laboratory | Miller et al. (2022)Other maker funded |
HRV (RMSSD)3 studies
| Device tested | Result | Reference | Sample | Study |
|---|---|---|---|---|
| Garmin Fenix 6 | 10.52%Mean absolute percentage error | ECG | n = 13, Home, during sleep, 536 nights | Dial et al. (2025)Independent |
| Garmin Fenix 6 | 0.87Lin's concordance correlation | ECG | n = 13, Home, during sleep, 536 nights | Dial et al. (2025)Independent |
| Garmin Forerunner 245 Music | ICC 0.24Intraclass correlation | ECG | n = 53, Overnight, sleep laboratory | Miller et al. (2022)Other maker funded |
| Garmin Forerunner 245 Music | 33.1 ms (absolute bias)Mean absolute error (absolute bias) | ECG | n = 53, Overnight, sleep laboratory | Miller et al. (2022)Other maker funded |
More results (1)
| Device tested | Result | Reference | Sample | Study |
|---|---|---|---|---|
| Garmin Vivoactive 4 | ρc = 0.66 (moderate)Lin's concordance correlation | ECG | n = 263, 30-min standardised recording | Theurl et al. (2023)Independent |
Sleep stages (4-stage)2 studies
| Device tested | Result | Reference | Sample | Study |
|---|---|---|---|---|
| Garmin Forerunner 245 Music | 50%Epoch-by-epoch agreement | Polysomnography (PSG) | n = 53, Sleep laboratory, 1 night, 9 h in bed, all devices worn together | Miller et al. (2022)Other maker funded |
| Garmin Forerunner 245 Music | κ = 0.25Cohen's kappa | Polysomnography (PSG) | n = 53, Sleep laboratory, 1 night, 9 h in bed, all devices worn together | Miller et al. (2022)Other maker funded |
| Garmin Vivosmart 4 | κ = 0.21Cohen's kappa | Polysomnography (PSG) | n = 25, Sleep laboratory, 1 night | Schyvens et al. (2025)Funding not reported |
Sleep vs wake (2-stage)3 studies
| Device tested | Result | Reference | Sample | Study |
|---|---|---|---|---|
| Garmin Vivosmart 4 | > 90% (all devices)Sensitivity | Polysomnography (PSG) | n = 62, Sleep laboratory, 1 night | Schyvens et al. (2025)Funding not reported |
| Garmin Fenix 5S | Worse than actigraphyStudy finding (no single number) | Polysomnography (PSG) | n = 34, Sleep laboratory, 3 nights incl. disrupted night | Chinoy et al. (2021)Funding not reported |
| Garmin Vivosmart 3 | Worse than actigraphyStudy finding (no single number) | Polysomnography (PSG) | n = 34, Sleep laboratory, 3 nights incl. disrupted night | Chinoy et al. (2021)Funding not reported |
| Garmin Forerunner 245 Music | 89%Epoch-by-epoch agreement | Polysomnography (PSG) | n = 53, Sleep laboratory, 1 night, 9 h in bed, all devices worn together | Miller et al. (2022)Other maker funded |
More results (1)
| Device tested | Result | Reference | Sample | Study |
|---|---|---|---|---|
| Garmin Forerunner 245 Music | κ = 0.35Cohen's kappa | Polysomnography (PSG) | n = 53, Sleep laboratory, 1 night, 9 h in bed, all devices worn together | Miller et al. (2022)Other maker funded |
Total sleep time1 study
| Device tested | Result | Reference | Sample | Study |
|---|---|---|---|---|
| Garmin Forerunner 945 | MAE 84.63 min (overestimate)Mean absolute error | Polysomnography (PSG) | n = 49, 1 night PSG + MSLT | Budig et al. (2022)Independent |
Blood oxygen (SpO2)5 studies
| Device tested | Result | Reference | Sample | Study |
|---|---|---|---|---|
| Garmin Vivosmart 4 | 3.3% (rest)Root-mean-square error | Medical-grade pulse oximeter | n = 36, Rest, COPD outpatients | Støve et al. (2023)Funding not reported |
| Garmin Venu 2S | 5.8% (RMSE 6.7%)Mean absolute error | Medical-grade pulse oximeter | n = 49, Spot readings, with and without chronic pulmonary disease | Jiang et al. (2023)Independent |
| Garmin Venu 2S | 6.7%Root-mean-square error | Medical-grade pulse oximeter | n = 49, Spot readings, with and without chronic pulmonary disease | Jiang et al. (2023)Independent |
| Garmin Fenix 5X Plus | 9.77% (ICC 0.549)Mean absolute percentage error | Arterial blood gas (SaO2) | n = 13, High altitude 4559 m | Schiefer et al. (2021)Independent |
More results (2)
| Device tested | Result | Reference | Sample | Study |
|---|---|---|---|---|
| Garmin Fenix 5X Plus | +3.3% at 12,000 ft (LoA −1.9 to 8.6%)Mean bias (signed) | Medical-grade pulse oximeter | n = 23, Normobaric hypoxia, rest, 900–12,000 ft | Lauterbach et al. (2021)Funding not reported |
| Garmin Fenix 6 | 4.29% (CCC 0.10)Mean absolute percentage error | Medical-grade pulse oximeter | n = 22, Normoxic and hypoxic conditions | Carrier et al. (2025)Independent |
VO2max estimate3 studies
| Device tested | Result | Reference | Sample | Study |
|---|---|---|---|---|
| Garmin Forerunner 245 | 7.9% / 7.2% (two runs)Mean absolute percentage error | Indirect calorimetry | n = 35, Treadmill ramp test | Engel et al. (2026)Funding not reported |
| Garmin Fenix 6 | 7.05% (CCC 0.73)Mean absolute percentage error | Indirect calorimetry | n = 19, Graded exercise test and outdoor run | Carrier et al. (2025)Independent |
| Garmin Forerunner 920XT | 7.3%Mean absolute percentage error | Indirect calorimetry | n = 24, Lab | Passler et al. (2019)Independent |
Energy expenditure (calories)3 studies
| Device tested | Result | Reference | Sample | Study |
|---|---|---|---|---|
| Garmin Fenix 5 | 15.9%–34.5% (range by intensity)Coefficient of variation | Indirect calorimetry | n = 25, Sitting, walking, running, sprints | Düking et al. (2020)Independent |
| Garmin Forerunner 955physical activity energy expenditure, 10 min | +68.61 kcalMean bias (signed) | Indirect calorimetry | n = 51, 10-min recumbent cycling intervals | Kostrna et al. (2026)Independent |
| Garmin Fenix 6walking | 32.0% walk / 21.8% runMean absolute percentage error | Indirect calorimetry | n = 20, Outdoor 2-km walk (6 km/ | Le et al. (2022)Independent |
Verdict
On paper the T-Rex Ultra offers longer battery than the Forerunner 265. Garmin has more published independent testing, though of older models and with mixed results. We make no accuracy ranking between the two brands.
Frequently asked questions
Is Amazfit heart rate as accurate as Garmin?
Unknown. ChatPPG has not verified a peer-reviewed study of the T-Rex Ultra, and no study has compared it with a Garmin watch.
Which has longer battery life?
Amazfit quotes up to 20 days typical use for the T-Rex Ultra; Garmin quotes up to 13 days for the Forerunner 265 and up to 16 days for the 47 mm Fenix 8 AMOLED.
Device research records
Datasets, papers and validation results for the models named on this page.