ECG vs Heart Rate Monitoring: Electrical Signals vs Optical Pulse Detection
ECG vs heart rate monitoring explained. Understand when ECG electrical signals or PPG optical pulse detection is the right tool for cardiac measurement.
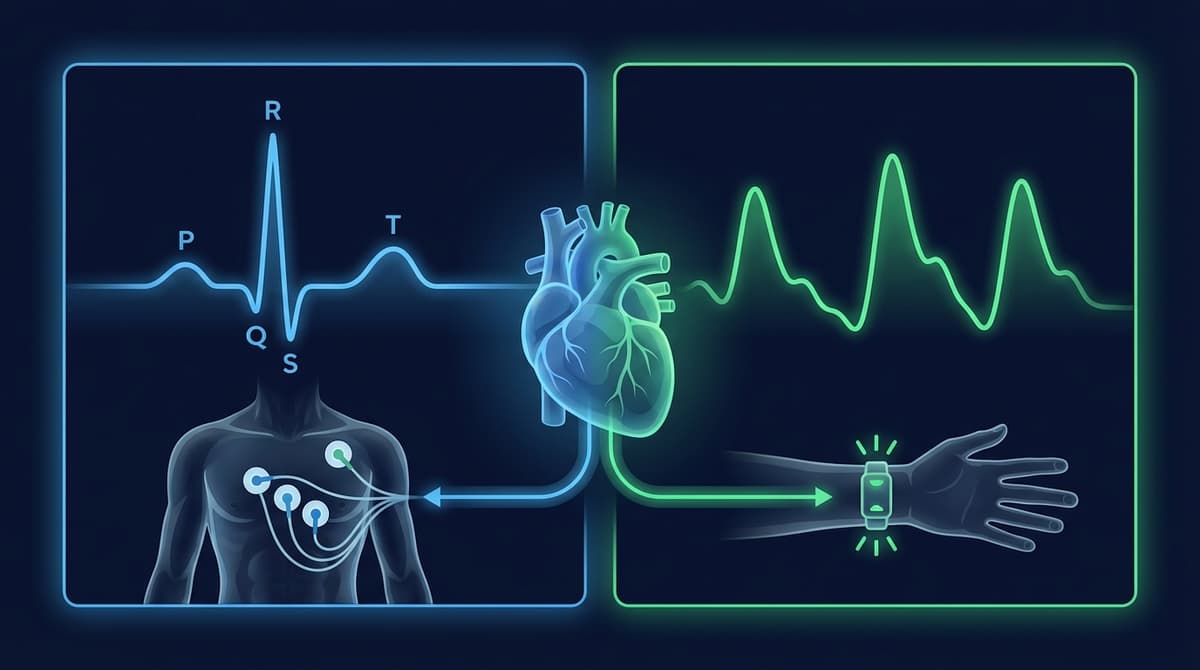
ECG (electrocardiogram) and optical heart rate monitoring (PPG) both measure cardiac activity, but they detect fundamentally different physical phenomena. An ECG records the electrical signals that trigger each heartbeat by placing electrodes on the skin. Optical heart rate monitors use LED light and a photodetector to track blood volume changes in tissue caused by each pulse. ECG is the clinical gold standard for diagnosing cardiac rhythm abnormalities, while PPG-based optical monitors excel at continuous, comfortable heart rate tracking during daily life and exercise.
What ECG Actually Measures
An ECG detects the electrical depolarization waves that spread through the heart muscle before each contraction. These electrical signals originate in the sinoatrial (SA) node, propagate through the atria, pass through the atrioventricular (AV) node, travel down the bundle of His, and spread through the ventricles via Purkinje fibers.
Electrodes on the skin surface pick up these voltage changes, which are amplified and displayed as the characteristic ECG waveform with its P wave, QRS complex, and T wave.
- P wave: Atrial depolarization. The signal that makes the atria contract.
- QRS complex: Ventricular depolarization. The sharp spike that triggers the main pumping contraction.
- T wave: Ventricular repolarization. The electrical reset before the next cycle.
Each of these components carries diagnostic information. A widened QRS might indicate a bundle branch block. A prolonged PR interval could suggest AV conduction delay. ST segment changes can indicate myocardial ischemia. Missing P waves with irregular R-R intervals are the hallmark of atrial fibrillation.
This is what makes ECG irreplaceable for cardiac diagnostics. It shows the electrical sequence of events within the heart, not just the mechanical result.
What Optical Heart Rate Monitors Measure
PPG-based heart rate monitors measure something entirely different: the mechanical consequences of each heartbeat. When the ventricles contract, they push blood into the arterial system. This pulse wave travels through arteries to capillary beds throughout the body, including the wrist, fingertip, or ear.
As blood volume increases in the capillaries during systole, more light is absorbed by hemoglobin. The photodetector sees less reflected light. During diastole, blood volume drops and more light returns. This creates a periodic waveform that tracks each pulse.
The PPG waveform looks different from an ECG trace. It has a smooth systolic upstroke, a peak, a dicrotic notch (corresponding to aortic valve closure), and a gradual diastolic decline. It does not show P waves, QRS complexes, or T waves because it is not measuring electrical activity at all.
For a comprehensive comparison of PPG and ECG signal characteristics, see our PPG vs. ECG comprehensive guide.
The Time Delay Between ECG and PPG
One important difference that is often overlooked: ECG and PPG events are not simultaneous. The electrical signal (QRS complex) comes first. It triggers the ventricular contraction. Then there is a delay, called the pre-ejection period (PEP), before blood is actually ejected. After ejection, the pulse wave takes additional time to travel from the heart to the peripheral measurement site.
The total delay between the ECG R-peak and the corresponding PPG pulse peak is called pulse arrival time (PAT). It typically ranges from 200-400 milliseconds, depending on measurement site and arterial stiffness.
This delay matters for timing-sensitive applications. If you are measuring heart rate variability (HRV), the intervals between consecutive ECG R-peaks (R-R intervals) are not identical to the intervals between consecutive PPG pulse peaks (pulse-pulse intervals or PPI). The difference is small at rest but can become significant during rapid heart rate changes. Our inter-beat interval accuracy analysis covers this in detail.
Heart Rate Measurement: Both Get You There
For simple heart rate measurement, both ECG and PPG work well. They both count cardiac cycles per minute, just from different perspectives.
ECG heart rate is derived from R-R intervals. The R-peak is sharp and well-defined, making it easy to detect even in noisy signals. Beat detection algorithms for ECG (like the Pan-Tompkins algorithm) are mature and highly reliable.
PPG heart rate is derived from pulse-pulse intervals or from frequency-domain analysis. The PPG waveform peak is broader and less distinct than the ECG R-peak, making precise timing slightly harder. However, for averaged heart rate over windows of 5-30 seconds, PPG accuracy matches ECG within 1-2 BPM under resting conditions.
At this basic level, the two methods give you essentially the same number. The question is: what else do you need beyond heart rate?
Heart Rate Variability: Where Timing Precision Matters
HRV analysis quantifies the variation in time between successive heartbeats. It is used to assess autonomic nervous system function, stress, recovery, and overall cardiovascular fitness.
ECG-based HRV uses R-R intervals. Because the R-peak is sharp and unambiguous, R-R interval timing is precise to within a few milliseconds. Time-domain metrics (SDNN, RMSSD, pNN50) and frequency-domain metrics (LF/HF ratio) derived from ECG are the clinical reference standard.
PPG-based HRV uses pulse-pulse intervals. Three sources of error affect accuracy:
-
Peak detection uncertainty. The rounded PPG peak is harder to time precisely than the sharp ECG R-peak. This adds measurement noise of roughly 5-15 ms to each interval.
-
Pulse transit time variability. The time it takes the pulse wave to travel from the heart to the sensor changes slightly with blood pressure, respiration, and autonomic tone. This means the PPG interval between two beats is not exactly the same as the ECG R-R interval for those same beats.
-
Motion artifacts. Any movement of the sensor disrupts the PPG waveform and can cause missed beats or false detections, corrupting the beat-to-beat interval series.
Despite these limitations, PPG-derived HRV correlates well with ECG-derived HRV under stationary conditions. Correlation coefficients above 0.95 for RMSSD during rest and sleep are commonly reported. During physical activity, the correlation drops substantially. A study by Charlton et al. (2022) in Physiological Measurement provides a thorough review of PPG-based HRV measurement accuracy.
Arrhythmia Detection: ECG's Home Territory
Detecting and diagnosing cardiac arrhythmias is where ECG has an unassailable advantage. The full 12-lead clinical ECG provides the spatial and temporal resolution needed to identify specific rhythm abnormalities, conduction defects, and structural heart disease.
Even single-lead wearable ECG devices like the Apple Watch ECG and AliveCor KardiaMobile provide enough information to screen for atrial fibrillation with high sensitivity and specificity. They show the P wave (or its absence), the QRS morphology, and the regularity of R-R intervals, all of which are needed for AF classification.
PPG can detect irregular rhythms by identifying irregular pulse-pulse intervals. The Apple Watch uses its PPG sensor for passive irregular rhythm notifications, flagging potential AF for follow-up ECG confirmation. Samsung and Fitbit offer similar features. These PPG-based screens are surprisingly effective as population-level filters, but they cannot diagnose the specific type of arrhythmia.
The key distinction: PPG can tell you that something is irregular. ECG can tell you what is irregular and why. For AF screening workflows, see our PPG atrial fibrillation screening guide.
Wearable ECG Devices
Consumer wearable ECG has grown rapidly. Several products now bring single-lead ECG to the wrist or phone.
Apple Watch Series 4 and later records a single-lead ECG by touching the Digital Crown with a finger from the opposite hand. One electrode is on the watch back (touching the wearing wrist), the other is the crown (touched by the opposite hand). This gives a Lead I equivalent. It is FDA-cleared for AF detection.
AliveCor KardiaMobile is a standalone 1-lead or 6-lead ECG recorder that pairs with a smartphone. It provides a more traditional ECG recording than the Apple Watch and has FDA clearance for detecting AF, bradycardia, and tachycardia.
Withings ScanWatch combines continuous PPG heart rate with on-demand single-lead ECG and SpO2.
These devices use ECG for on-demand rhythm checks and PPG for continuous heart rate monitoring. The two technologies complement each other in a single device.
When to Use Which Technology
Use ECG When:
- You need to diagnose specific cardiac arrhythmias
- You need precise R-R interval timing for clinical HRV analysis
- You are monitoring for conduction abnormalities, ST changes, or other waveform morphology
- You need a legal, clinical-grade cardiac record
- You are performing pre-surgical or post-surgical cardiac monitoring
Use PPG When:
- You want continuous, passive heart rate monitoring throughout the day
- You are tracking heart rate during exercise and want minimal intrusion
- You need overnight resting heart rate and HRV trends over weeks or months
- You want SpO2 blood oxygen measurement (PPG with red + IR LEDs)
- You need an estimate of respiratory rate from cardiac signal modulation
- You want population-level screening with follow-up ECG for positives
Use Both When:
- You need continuous background monitoring (PPG) with on-demand detailed rhythm checks (ECG)
- You are measuring pulse transit time for cuffless blood pressure estimation
- You are validating PPG-derived metrics against ECG ground truth
- You want AF screening (PPG) with diagnostic confirmation (ECG) in one device
R-R Intervals vs. Pulse-Pulse Intervals
This distinction deserves emphasis because it is a common source of confusion.
R-R intervals are measured from ECG. They represent the time between consecutive ventricular depolarizations. This is the electrical trigger for each heartbeat.
Pulse-pulse intervals (PPI) are measured from PPG. They represent the time between consecutive pulse wave arrivals at the sensor site. This is the mechanical result of each heartbeat, delayed by pulse transit time.
R-R and PPI are strongly correlated but not identical. The difference arises because pulse transit time itself varies beat to beat, modulated by blood pressure, respiration, and autonomic activity. For heart rate calculation (which averages over many beats), this difference washes out. For beat-to-beat HRV analysis, it introduces noise.
Several studies have quantified the PPI-vs-RR agreement. Under resting conditions, the mean absolute difference is typically below 5 ms per beat, and RMSSD values agree within 5-10%. During exercise or physiological stress, agreement degrades. For applications requiring clinical-grade HRV, ECG remains the recommended source. For wellness-level HRV trending, PPG-derived PPI is sufficient.
For more on PPG heart rate accuracy, see our heart rate accuracy analysis.
Cost and Accessibility
ECG has traditionally been a clinical tool. A 12-lead ECG machine costs thousands of dollars and requires trained technicians to operate and interpret. Even portable Holter monitors, which record 24-48 hours of ambulatory ECG, cost hundreds of dollars and require physician involvement.
PPG sensors cost under a dollar for the raw component and are embedded in devices people already own. The democratization of heart rate monitoring through PPG is arguably one of the most significant developments in consumer health technology. Billions of people now have continuous heart rate monitoring via their smartphone or wearable device.
Wearable ECG devices (Apple Watch, KardiaMobile) have brought the cost of on-demand ECG down to consumer price points, but they still require an intentional recording action. PPG runs passively and continuously with no user effort.
Accuracy Under Different Conditions
| Condition | ECG Heart Rate | PPG Heart Rate | Notes |
|---|---|---|---|
| Resting, seated | Reference standard | Within 1-2 BPM | Both excellent |
| Sleep | Reference standard | Within 1-2 BPM | PPG benefits from zero motion |
| Walking | Reference standard | Within 2-4 BPM | Mild wrist motion affects PPG |
| Running | Reference standard | Within 3-8 BPM | Depends on device and intensity |
| Swimming | Unreliable (water) | 5-15 BPM error | Water disrupts both technologies |
| Cold environment | Unaffected | Degraded (vasoconstriction) | PPG needs peripheral blood flow |
Frequently Asked Questions
Is ECG more accurate than a heart rate monitor?
ECG provides a more precise measurement of cardiac timing because it detects the sharp electrical R-peak directly. For simple heart rate (beats per minute averaged over 10-30 seconds), both ECG and optical heart rate monitors give essentially the same result at rest. ECG is more accurate during intense exercise and for beat-to-beat interval analysis.
Can a PPG heart rate monitor detect arrhythmia?
PPG can detect irregular pulse rhythms and flag potential atrial fibrillation. The Apple Watch, Fitbit, and Samsung Galaxy Watch all offer irregular rhythm notification features based on PPG analysis. However, PPG cannot diagnose the specific type of arrhythmia. A positive PPG screen should always be followed up with an ECG recording for definitive diagnosis.
Why do some smartwatches have both ECG and optical heart rate sensors?
The two technologies serve different roles. PPG runs continuously in the background for all-day heart rate and SpO2 monitoring. ECG is activated on demand for specific rhythm checks. Using both gives continuous monitoring with the ability to record clinical-quality data when something unusual is detected.
What is the difference between heart rate and ECG?
Heart rate is a single number representing how many times your heart beats per minute. It can be measured by many methods, including ECG, PPG, auscultation, or palpation. An ECG is a recording of the heart's electrical activity showing the P wave, QRS complex, and T wave waveform morphology. ECG contains far more information than just heart rate.
Can I use my Apple Watch ECG instead of a medical ECG?
The Apple Watch records a single-lead ECG equivalent (Lead I). A clinical 12-lead ECG records from 10 electrodes placed on the chest and limbs, providing 12 different views of the heart's electrical activity. The Apple Watch ECG is FDA-cleared for AF detection and can provide useful screening data, but it cannot replace a 12-lead ECG for comprehensive cardiac diagnosis.
How does pulse transit time connect ECG and PPG?
Pulse transit time (PTT) is the delay between the ECG R-peak (when the ventricles fire electrically) and the PPG pulse arrival at a peripheral site. PTT reflects arterial stiffness and blood pressure. By measuring both ECG and PPG simultaneously, you can calculate PTT on a beat-by-beat basis. This is the basis for cuffless blood pressure estimation, an active area of research.
Is ECG or PPG better for measuring HRV?
ECG provides more accurate beat-to-beat timing due to the sharp R-peak, making it the reference standard for clinical HRV analysis. PPG-based HRV is accurate enough for wellness tracking and trend monitoring, particularly during rest and sleep. For clinical research or medical decision-making based on HRV, ECG is preferred.