PPG vs ECG Comprehensive
Photoplethysmography (PPG) and electrocardiography (ECG) are the two most widely deployed cardiac monitoring technologies in existence, yet they measu...
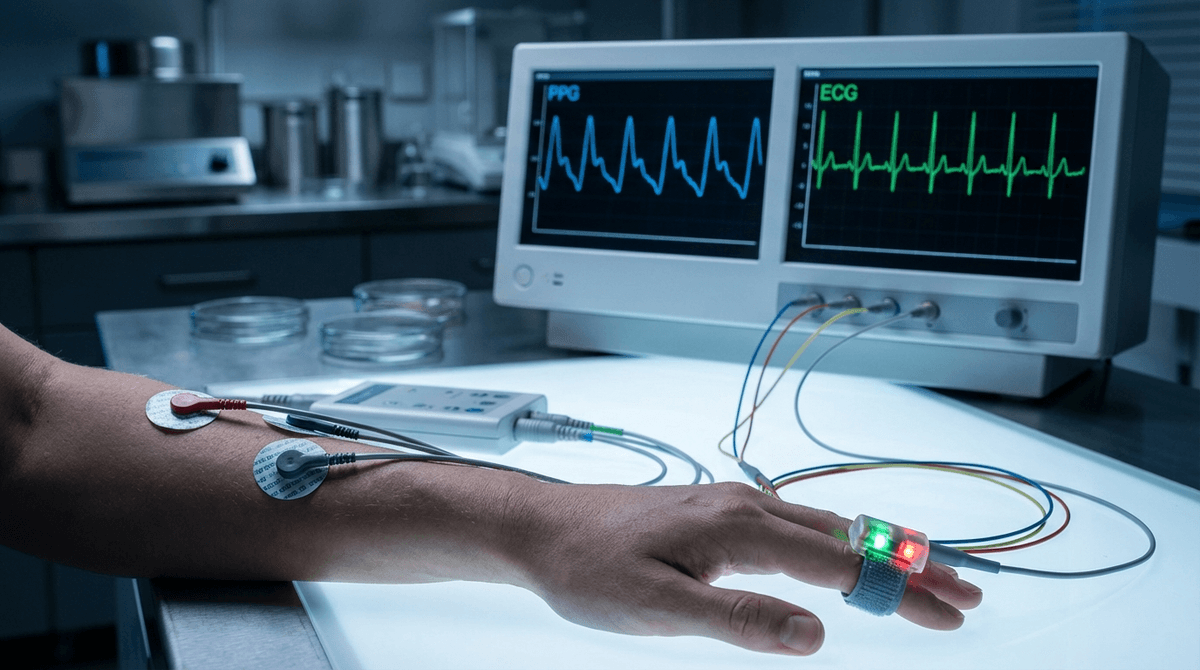
Photoplethysmography (PPG) and electrocardiography (ECG) are the two most widely deployed cardiac monitoring technologies in existence, yet they measure fundamentally different physiological phenomena. ECG captures the electrical depolarization and repolarization of cardiac muscle tissue. PPG captures the mechanical consequence of those electrical events: the volumetric blood pulse as it arrives at peripheral tissue. Understanding the precise technical differences between these modalities is essential for researchers designing studies, engineers building devices, and clinicians interpreting data from either source.
This comparison goes beyond surface-level differences to examine signal origins, waveform morphology, timing relationships, accuracy boundaries, and the specific use cases where each technology excels or falls short. For foundational background on PPG signal generation, see our introduction to photoplethysmography.
Signal Origins and Physics
ECG: Electrical Activity of the Heart
ECG measures the potential difference between electrodes placed on the body surface, generated by the coordinated depolarization and repolarization of cardiac myocytes. The signal originates at the sinoatrial (SA) node, propagates through the atrial tissue, passes through the atrioventricular (AV) node with a characteristic delay, travels rapidly through the His-Purkinje system, and activates the ventricular myocardium. Each of these phases produces distinct voltage deflections on the ECG trace.
The standard clinical 12-lead ECG uses 10 electrodes to create 12 different views of the heart's electrical vector. Single-lead ECG, increasingly common in wearable devices, uses two electrodes (typically on the wrists or between wrist and finger) to capture a single lead that approximates Lead I of the standard configuration. The signal amplitude ranges from 0.5 to 3.0 mV for the QRS complex, with the P-wave and T-wave typically an order of magnitude smaller.
ECG signal quality depends on electrode-skin impedance, which is influenced by skin preparation, electrode gel condition, hair, sweat, and motion. Typical electrode impedance ranges from 1-50 kohms, and signal bandwidth extends from 0.05 to 150 Hz for diagnostic-quality recordings, though most wearable devices limit bandwidth to 0.5-40 Hz (Kligfield et al., 2007; DOI: 10.1016/j.jacc.2006.12.015).
PPG: Mechanical Blood Volume Pulse
PPG measures changes in light absorption or reflection caused by pulsatile blood volume in the microvasculature. An LED emits light into tissue, and a photodetector captures the transmitted or reflected light. As arterial blood volume increases during systole, light absorption increases and the detected light intensity decreases (for transmission mode) or changes (for reflectance mode), creating the characteristic PPG waveform.
The PPG signal originates not from the heart directly but from the peripheral vasculature at the measurement site. The blood volume pulse that PPG detects is shaped by cardiac output, arterial compliance, vascular resistance, and the elastic properties of the arterial tree between the heart and the sensor location. This means the PPG waveform carries information about both cardiac function and vascular health, but the cardiac information is filtered and delayed compared to ECG.
PPG signal amplitude is typically quantified as the AC/DC ratio (pulsatile component relative to the baseline). This ratio ranges from 0.5-5% depending on wavelength, measurement site, and individual physiology. For technical details on wavelength selection and its impact on signal quality, see our wavelength comparison guide.
Waveform Morphology Comparison
ECG Waveform Components
The ECG waveform contains five principal deflections within each cardiac cycle, each with specific clinical significance:
P-wave (duration 80-120 ms, amplitude 0.1-0.25 mV): Represents atrial depolarization. Its morphology indicates atrial size, conduction pathways, and atrial rhythm. Absence of organized P-waves is the hallmark of atrial fibrillation.
QRS complex (duration 80-120 ms, amplitude 0.5-3.0 mV): Represents ventricular depolarization. The sharp R-peak provides the most precise fiducial point for beat-to-beat timing, with detection accuracy achievable to within 1-2 ms using standard algorithms like Pan-Tompkins (Pan & Tompkins, 1985; DOI: 10.1109/TBME.1985.325532).
T-wave (duration 120-200 ms): Represents ventricular repolarization. ST-segment elevation or depression relative to the baseline indicates myocardial ischemia or infarction. T-wave morphology changes can indicate electrolyte abnormalities or drug effects.
PR interval (120-200 ms): Reflects conduction time through the AV node. Prolongation indicates first-degree AV block.
QT interval (350-440 ms, rate-corrected): Reflects total ventricular electrical activity duration. Prolongation increases the risk of life-threatening arrhythmias.
PPG Waveform Components
The PPG waveform has fewer discrete features but carries different physiological information:
Systolic peak: The maximum amplitude of the pulse wave, corresponding to peak blood volume in the measurement site. The systolic upstroke time (from onset to peak) is typically 100-200 ms and correlates with arterial stiffness and left ventricular ejection time.
Dicrotic notch: A small inflection on the descending limb of the pulse wave, caused by aortic valve closure and the resulting reflected pressure wave. The dicrotic notch position and amplitude provide information about aortic valve function and peripheral vascular resistance. In older adults or those with increased arterial stiffness, the dicrotic notch may be absent or attenuated (Elgendi, 2012; DOI: 10.1016/j.cmpb.2012.09.005).
Diastolic phase: The descending portion after the dicrotic notch, reflecting the exponential decay of blood volume during diastole. The decay rate correlates with total peripheral resistance and arterial compliance.
The PPG waveform can be further analyzed using its second derivative (acceleration plethysmogram, APG), which decomposes the pulse into five characteristic waves (a, b, c, d, e) that have been correlated with vascular aging indices (Takazawa et al., 1998; DOI: 10.1038/hr.1998.32).
Timing Relationships: PTT and PAT
A critical difference between PPG and ECG is timing. The ECG R-peak marks the electrical trigger for ventricular contraction, while the PPG systolic peak marks the arrival of the resulting blood volume pulse at the peripheral measurement site. The delay between these two events is clinically significant.
Pulse Transit Time (PTT) is defined as the time for the pressure pulse to travel between two arterial sites. It is calculated as the difference between the PPG pulse arrival at a distal site and either the ECG R-peak or a proximal PPG measurement. PTT is inversely related to arterial stiffness and blood pressure through the Moens-Korteweg equation.
Pulse Arrival Time (PAT) is the interval from the ECG R-peak to the PPG foot (onset) at a peripheral site. PAT includes both the pre-ejection period (PEP), which is the isovolumetric contraction time of the ventricle, and the actual pulse transit time. PAT typically ranges from 200-400 ms for the finger and 150-300 ms for the ear.
The relationship between PTT and blood pressure has been extensively studied for cuffless blood pressure estimation. Mukkamala et al. (2015; DOI: 10.1109/TBME.2015.2441951) demonstrated that PTT-based systolic blood pressure estimation achieves root-mean-square errors of 8-15 mmHg, insufficient for clinical-grade measurement but potentially useful for trend monitoring. The confounding effect of PEP variability is a major limitation when using PAT instead of true PTT.
Heart Rate Measurement Accuracy
Both modalities can measure heart rate, but with different precision characteristics.
ECG Heart Rate Precision
ECG-derived heart rate uses the R-R interval, which can be detected with timing precision of 1-2 ms using well-established algorithms. The Pan-Tompkins algorithm, published in 1985, remains a foundational approach, achieving sensitivity above 99.5% and positive predictivity above 99.5% on the MIT-BIH Arrhythmia Database. Modern deep learning approaches have pushed R-peak detection sensitivity above 99.8% even in noisy recordings (Hannun et al., 2019; DOI: 10.1038/s41591-018-0268-3).
ECG heart rate measurement is relatively robust to motion because the QRS complex has a distinctive high-frequency morphology (10-25 Hz energy concentration) that separates well from low-frequency motion artifact in the spectral domain.
PPG Heart Rate Precision
PPG-derived heart rate uses the peak-to-peak interval (pulse-to-pulse interval, PPI) or onset-to-onset interval. The PPG systolic peak is broader than the ECG R-peak, with a rounded morphology that makes precise fiducial point detection more challenging. Typical timing uncertainty for PPG peak detection is 5-20 ms, significantly worse than ECG.
Validation studies consistently show excellent PPG-ECG heart rate agreement at rest. Bent et al. (2020; DOI: 10.1038/s41746-020-0226-6) evaluated six commercial wrist-worn devices against ECG and found mean absolute errors of 1.8-7.2 BPM across devices, with the best performers achieving errors below 2 BPM at rest. During exercise, Nelson et al. (2020) reported that wrist PPG devices showed mean absolute percentage errors of 2.4-9.6% depending on exercise intensity and device brand.
For a deeper understanding of how motion artifacts degrade PPG heart rate accuracy and the algorithms used to mitigate this, see our motion artifact removal guide.
Heart Rate Variability: PRV vs HRV
Heart rate variability (HRV) analysis from PPG is technically pulse rate variability (PRV), and the distinction matters for research applications.
Time-Domain Metrics
Time-domain HRV metrics from PPG show strong correlation with ECG during stationary recordings. Schaffarczyk et al. (2022; DOI: 10.3390/s22186764) conducted a meta-analysis and found that SDNN measured from PPG correlated with ECG-derived SDNN at r = 0.96 (95% CI: 0.94-0.97) during rest. RMSSD showed similar agreement (r = 0.95, 95% CI: 0.93-0.97).
However, during physical activity or conditions that alter vascular tone (cold exposure, mental stress with sympathetic activation), PRV and HRV can diverge. This occurs because changes in pulse transit time and arterial compliance introduce variability in the pulse arrival time that is independent of cardiac rhythm variability. Gil et al. (2010; DOI: 10.1109/TBME.2010.2050791) quantified this effect and found that the additional variability from PTT changes was small at rest (contributing less than 5% to total variability) but could exceed 15% during orthostatic challenge.
Frequency-Domain Metrics
Frequency-domain HRV analysis is more sensitive to the PRV-HRV discrepancy. The low-frequency (LF, 0.04-0.15 Hz) and high-frequency (HF, 0.15-0.4 Hz) power bands, and particularly the LF/HF ratio, show lower agreement between PPG and ECG than time-domain metrics. Constant et al. (1999) reported that LF/HF ratio from PPG deviated from ECG by 10-25% in some subjects, likely because respiratory-induced blood pressure variations modulate the PPG waveform in the HF band independently of cardiac rhythm.
For clinical HRV research, ECG remains the recommended modality. For consumer wellness applications where trend monitoring is sufficient, PPG-derived HRV provides adequate accuracy. Our HRV by age reference charts provide population normative data.
Arrhythmia Detection Capabilities
ECG Arrhythmia Detection
ECG is the undisputed gold standard for arrhythmia detection and classification. The 12-lead ECG can identify and classify virtually all clinically significant arrhythmias including:
- Atrial fibrillation and flutter (P-wave analysis)
- Supraventricular and ventricular tachycardias (QRS morphology and rate)
- AV blocks of all degrees (PR interval analysis)
- Bundle branch blocks (QRS duration and morphology)
- Premature atrial and ventricular contractions (P/QRS morphology and timing)
- Long QT syndrome (QT interval measurement)
- Wolff-Parkinson-White syndrome (delta wave detection)
Single-lead wearable ECG devices like the Apple Watch ECG, AliveCor KardiaMobile, and Withings ScanWatch can reliably detect atrial fibrillation with sensitivity of 93-99% and specificity of 94-99% (Bumgarner et al., 2018; DOI: 10.1016/j.jacc.2018.01.039). However, single-lead devices cannot detect all arrhythmias that require multi-lead spatial information.
PPG Arrhythmia Detection
PPG-based arrhythmia detection is limited to rhythm irregularity analysis because PPG cannot visualize P-waves, QRS morphology, or ST segments. PPG can detect:
- Atrial fibrillation: Through irregular pulse-to-pulse intervals and absence of the dicrotic notch regularity. The Apple Heart Study enrolled 419,297 participants and found that 0.52% received irregular pulse notifications, of which 34% were confirmed AF by ECG patch (Perez et al., 2019; DOI: 10.1056/NEJMoa1901183).
- Premature beats: Through characteristic patterns of short-long interval sequences.
- Tachycardia/bradycardia: Through sustained rate changes above or below normal thresholds.
PPG cannot differentiate between different types of supraventricular tachycardia, cannot detect AV blocks (except high-degree blocks with ventricular pauses), and cannot identify ischemic changes. For a deeper exploration of PPG-based AF detection, see our AF detection guide.
Use Case Decision Framework
When ECG Is Required
ECG should be chosen when the application requires: diagnosis-level arrhythmia classification, ST-segment analysis for ischemia detection, QT interval monitoring (drug studies, genetic screening), precise beat-to-beat timing for research-grade HRV analysis, or any scenario where regulatory standards mandate ECG (such as cardiac telemetry in hospitals).
When PPG Is Sufficient or Superior
PPG is preferred when the application requires: continuous unobtrusive monitoring (wrist, finger, ear), SpO2 measurement (ECG cannot measure blood oxygenation at all), vascular health assessment (arterial stiffness, PWV), scenarios where electrode application is impractical (continuous daily monitoring, sleep tracking), or when combined cardiac and vascular metrics are needed. PPG also offers the advantage of measuring peripheral perfusion, which ECG cannot assess. For information on the algorithms that extract clinical parameters from PPG, see our algorithms reference.
Complementary Use
The most powerful approach combines both modalities. Simultaneous ECG and PPG enables PTT-based blood pressure estimation, cardiac output assessment, pre-ejection period measurement, and comprehensive cardiac-vascular profiling. Research devices like the Biopac MP160 and clinical monitors from Philips and GE capture both signals simultaneously.
Signal Processing Differences
The signal processing pipelines for ECG and PPG differ substantially. ECG processing focuses on preserving the sharp QRS complex while removing baseline wander (0.05-0.5 Hz high-pass filter) and powerline interference (50/60 Hz notch filter). The diagnostic bandwidth is 0.05-150 Hz, while monitoring bandwidth is typically 0.5-40 Hz.
PPG processing focuses on extracting the relatively slow pulse waveform (fundamental frequency 0.5-4 Hz) from a signal contaminated by motion artifact, ambient light interference, and baseline drift. Typical PPG processing bandwidth is 0.5-8 Hz for heart rate extraction. Advanced PPG processing may include adaptive filtering with accelerometer reference signals, independent component analysis, or deep learning denoising. For comprehensive coverage of PPG signal processing approaches, see our signal processing algorithms page.
A key difference is that ECG motion artifact is primarily additive (electrode motion generates voltage transients superimposed on the cardiac signal), while PPG motion artifact is both additive and multiplicative (sensor motion changes the optical path, modulating the entire signal amplitude). This multiplicative nature makes PPG motion artifact fundamentally harder to remove with linear methods.
Emerging Convergence
The boundary between PPG and ECG is blurring in modern wearable devices. The Apple Watch Series 4 and later include both an optical PPG sensor for continuous heart rate and a single-lead ECG for on-demand rhythm assessment. Samsung Galaxy Watch devices offer similar dual-modality capabilities. Research platforms like the Empatica E4 (now EmbracePlus) combine PPG, ECG, EDA, and accelerometer data for multimodal physiological monitoring.
The trend toward sensor fusion, where PPG and ECG data are processed jointly rather than independently, promises to deliver capabilities that neither modality achieves alone. Combined PPG-ECG analysis for cuffless blood pressure, cardiac output estimation, and enhanced arrhythmia detection represents an active area of research with significant potential to improve both clinical monitoring and consumer health devices. For an overview of PPG clinical applications and ongoing research, visit our conditions and clinical use cases page.
Conclusion
PPG and ECG are complementary rather than competing technologies. ECG provides unmatched access to cardiac electrical activity, enabling precise arrhythmia diagnosis, ischemia detection, and research-grade HRV analysis. PPG provides continuous, unobtrusive monitoring of the mechanical cardiovascular system, enabling SpO2 measurement, vascular health assessment, and 24/7 heart rate tracking without electrodes. The choice between them depends on the specific clinical question, the required measurement precision, the monitoring duration, and the practical constraints of the use case. For most modern health monitoring applications, the optimal approach is to use both modalities where feasible, leveraging each for its unique strengths.