What Is Pleth on a Hospital Monitor? The PPG Waveform Explained
Pleth on a hospital monitor is the PPG waveform showing real-time blood flow with each heartbeat. Learn what it means, what a normal pleth looks like, and what changes signal a problem.
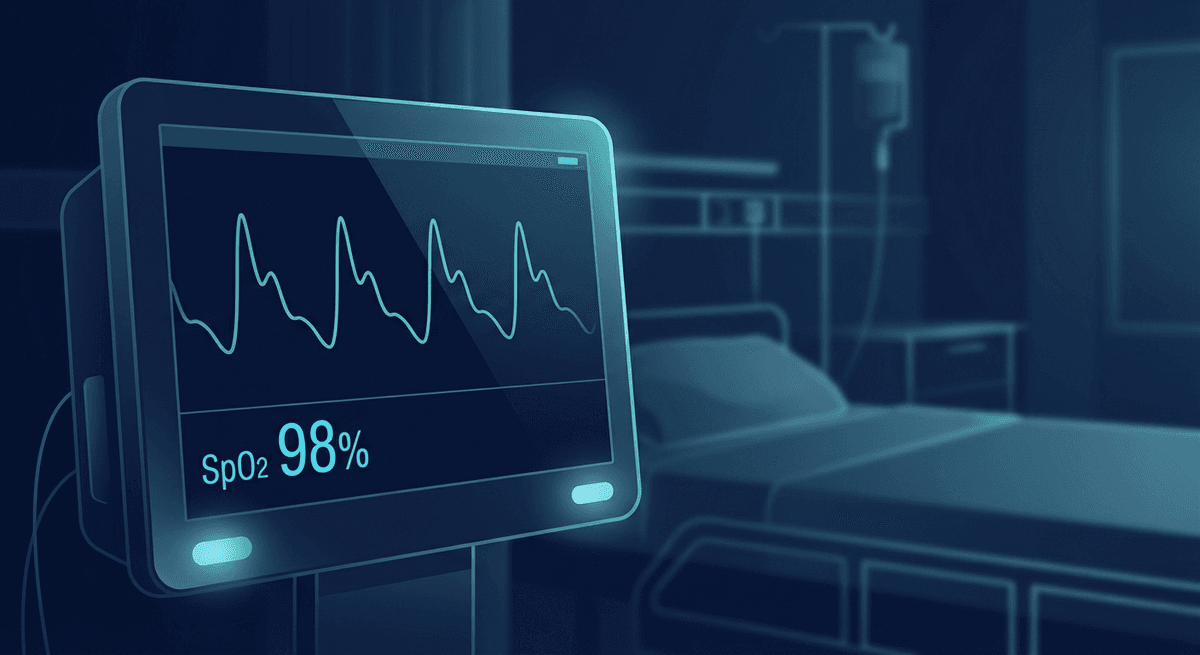
The "Pleth" displayed on a hospital monitor is a real-time waveform showing blood flow through the peripheral vasculature with each heartbeat. It is the graphical output of a photoplethysmography (PPG) sensor — usually the same sensor clipped to a fingertip that also measures SpO₂. Clinicians use it to confirm pulse quality, assess peripheral perfusion, and detect waveform abnormalities that standard numbers alone cannot reveal.
Most patients and family members notice the pleth waveform scrolling across the monitor screen alongside the green ECG trace and the SpO₂ and heart rate numbers — but the waveform itself is rarely explained. Here is what it means and why it matters.
What the Pleth Waveform Represents
Each peak in the pleth waveform corresponds to one heartbeat. The rise of the wave represents blood arriving in the finger (or other measurement site) as the heart contracts and pushes a bolus into the arterial system. The fall represents relaxation and the partial withdrawal of that pulse wave.
The waveform has several identifiable features:
Systolic peak: The highest point of each waveform, occurring shortly after the cardiac systolic ejection. Its timing relative to the ECG R-wave is called the pulse arrival time or pulse transit time.
Dicrotic notch: A small dip on the descending limb of the waveform, occurring when the aortic valve closes. In healthy, relatively young adults with good vascular compliance, this notch is visible and distinct. As arterial stiffness increases with age or disease, the notch moves upward and becomes less pronounced.
Diastolic component: The second, lower peak that follows the dicrotic notch. Its relative height compared to the systolic peak reflects the degree of peripheral vascular tone and wave reflection.
Waveform amplitude: The vertical height from trough to systolic peak. This reflects perfusion quality at the measurement site — how much blood is arriving with each beat. It is directly related to the perfusion index displayed numerically on many monitors.
What Does a Normal Pleth Look Like?
A normal pleth waveform is:
- Regular: Peaks spaced evenly, reflecting a steady cardiac rhythm
- Smooth: Clean upstroke and downstroke without excessive noise or artifact
- Appropriately tall: Consistent amplitude indicating adequate peripheral perfusion
- Showing a dicrotic notch: A small but visible notch on the descending limb in patients with good vascular compliance
- Matching the SpO₂ and heart rate: The beat count should correspond exactly to the heart rate readout
When the pleth looks good, it validates that the SpO₂ number being displayed is reliable. When the pleth is poor — small, noisy, or erratic — the SpO₂ number should be treated with caution regardless of what it reads.
What Causes a Poor Pleth Waveform?
Several clinical situations degrade the pleth signal:
Poor peripheral perfusion: Cold extremities, vasoconstriction, hypotension, and shock all reduce blood flow to the fingers, shrinking the waveform amplitude. In intensive care settings, a pleth waveform that suddenly flattens can be an early warning of hemodynamic deterioration before blood pressure alarms trigger.
Probe displacement: If the fingertip probe is loose, twisted, or poorly positioned, the waveform becomes noisy and unreliable. This is the most common cause of a degraded pleth in stable patients.
Motion artifact: Any movement of the hand or arm injects rhythmic noise into the signal. The waveform becomes jagged and irregular. Most modern monitors use signal quality algorithms to flag this — but the waveform itself makes it visually obvious.
Nail polish and artificial nails: Dark nail polish (especially blue, purple, black) and acrylic nails interfere with light transmission through the fingertip. Moving the probe to the side of the finger or using an ear probe is the fix.
Arrhythmias: Irregular heartbeats produce an irregular pleth, with beats of varying amplitude. Atrial fibrillation causes beats with variable strength (due to varying fill time), producing a characteristically variable waveform height. Premature beats may produce a lower-amplitude pulse if ventricular filling was incomplete.
Beyond confirming that the SpO₂ reading is real, clinicians experienced with waveform analysis extract additional clinical meaning from the pleth.
Respiratory variation: In mechanically ventilated patients, the pleth waveform amplitude varies with the respiratory cycle — rising during expiration and falling during inspiration when the patient is hypovolemic. This variation, sometimes called pulse pressure variation (PPV) or plethysmographic variability index (PVI), predicts fluid responsiveness with reasonable accuracy (Cannesson et al., 2008, Anesthesiology). A PVI above 13–15% suggests the patient will likely respond to a fluid challenge.
Vascular tone assessment: The shape of the waveform — particularly the height and position of the dicrotic notch — reflects peripheral vascular resistance and arterial compliance. In septic vasodilation, the waveform becomes very tall and bouncy with a prominent dicrotic notch. In severe vasoconstriction (high-dose vasopressors), it becomes narrow and attenuated.
Arrhythmia confirmation: When the ECG trace shows something unusual — a run of irregular beats, a pause, or a noisy segment — the pleth provides an independent confirmation of whether those beats are producing mechanical output. Pulseless electrical activity (PEA) shows electrical activity on ECG but no waveform on pleth.
Perfusion index trending: Many monitors calculate and display the perfusion index (PI) — the ratio of the pulsatile (AC) to non-pulsatile (DC) components of the PPG signal. Trending PI over time helps track response to vasodilators, sympathomimetics, or fluid administration.
Pleth vs. Arterial Line Waveform: Key Differences
Patients in the ICU or operating room may have both a pleth waveform (from the fingertip SpO₂ probe) and an arterial line waveform displayed simultaneously. They look similar but carry different information.
The arterial line waveform reflects actual arterial blood pressure changes in real time — its absolute values are calibrated and quantitative. The pleth waveform reflects light absorption changes and is not calibrated to pressure units. However, the shape and variation of both waveforms often track closely in hemodynamically stable patients. During rapid hemodynamic changes, the arterial line responds immediately while the pleth may lag by a beat or two due to pulse transit time from the central aorta to the finger.
The Pleth as a Safety Check for SpO₂ Readings
One of the most practical uses of the pleth in clinical practice is validating SpO₂ accuracy. A perfect SpO₂ value of 98% means nothing if the pleth waveform is flat, noisy, or missing. The rule of thumb: no reliable pleth, no reliable SpO₂.
Nellcor, Masimo, and Philips pulse oximeters all display some form of signal quality indicator alongside the SpO₂ value. Masimo's Signal IQ and Rainbow technology, for instance, use sophisticated pleth signal analysis to filter out artifact and report a confidence level with each reading. But even with these tools, the waveform itself remains the fastest visual sanity check available to a bedside clinician.
Frequently Asked Questions
What does pleth mean on a hospital monitor? Pleth is shorthand for plethysmography. On a hospital monitor, it specifically refers to the photoplethysmography (PPG) waveform — a graphical display of blood pulsing through peripheral tissue, captured by the SpO₂ probe. Each peak represents one heartbeat.
Is the pleth the same as the pulse oximeter reading? They come from the same sensor, but they represent different things. The SpO₂ number is a calculated ratio of light absorption at two wavelengths (red and near-infrared). The pleth is the raw waveform from one of those wavelengths, showing pulsatile blood flow in real time. The pleth validates the quality of the SpO₂ reading.
What does a poor pleth waveform mean? A poor pleth — small amplitude, irregular, or noisy — usually means poor peripheral perfusion (cold, hypotensive, or vasoconstricted patient) or a probe placement problem. It makes SpO₂ readings unreliable and may indicate a hemodynamic problem worth investigating.
Why does the pleth waveform vary with breathing? In mechanically ventilated patients, intrathoracic pressure changes with each breath affect venous return and therefore cardiac output. This makes each beat slightly stronger or weaker depending on where it falls in the respiratory cycle, producing a rhythmic variation in waveform amplitude. Significant variation suggests the patient may be volume-depleted and responsive to fluids.
Can the pleth detect atrial fibrillation? It can flag an irregular rhythm. In AF, the pleth shows irregularly irregular beats with varying amplitude — a characteristic pattern. However, confirming AF requires an ECG. Learn more about PPG-based AF detection.
What is perfusion index on a hospital monitor? Perfusion index (PI) is a numerical value derived from the pleth waveform — specifically the ratio of pulsatile to non-pulsatile light absorption. A higher PI (above 1–2%) indicates good peripheral perfusion. A PI below 0.5% suggests poor perfusion and should prompt probe repositioning or clinical assessment.
Why does the monitor say "low perfusion" or "check probe"? These alerts mean the pleth signal is too small or too noisy to generate a reliable reading. The most common causes: cold fingers, probe loosely attached, nail polish blocking the LED, or genuinely poor peripheral circulation. Try a different finger, the earlobe, or a forehead probe.
References
-
Cannesson, M., Attof, Y., Rosamel, P., et al. (2008). Respiratory variations in pulse oximetry plethysmographic waveform amplitude to predict fluid responsiveness in the operating room. Anesthesiology, 106(6), 1105–1111. https://doi.org/10.1097/ALN.0b013e318173f092
-
Jubran, A. (2015). Pulse oximetry. Critical Care, 19, 272. https://doi.org/10.1186/s13054-015-0984-8
-
Shelley, K. H. (2007). Photoplethysmography: beyond the calculation of arterial oxygen saturation and heart rate. Anesthesia & Analgesia, 105(6 Suppl), S31–S36. https://doi.org/10.1213/01.ane.0000269512.82836.c9
-
Frey, B., & Butt, W. (1998). Pulse oximetry for assessment of peripheral perfusion: Implications for the management of peripheral artery disease. Journal of Pediatric Surgery, 33(3), 436–439. https://doi.org/10.1016/S0022-3468(98)90082-6