Underdamped Arterial Line Troubleshooting: Causes, Square Wave Test, and PPG Parallels
How to identify and fix an underdamped arterial line. Covers square wave test interpretation, causes of underdamping, and parallels with PPG signal ringing.
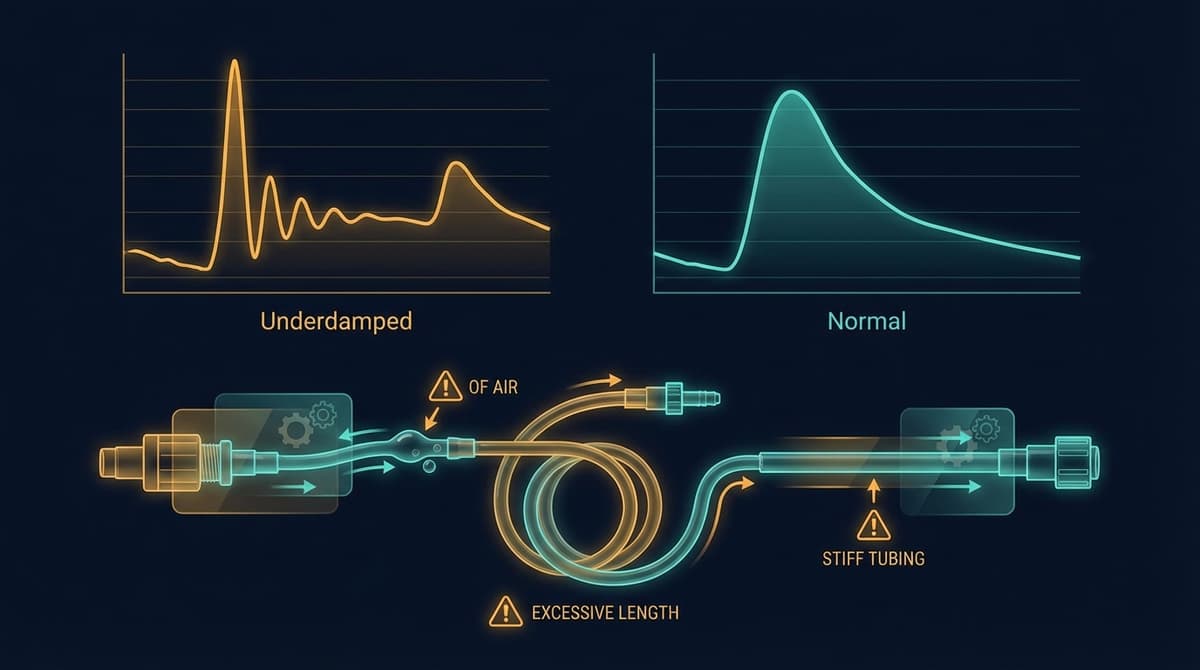
An underdamped arterial line produces a waveform with exaggerated systolic overshoot and artificial ringing after the systolic peak, causing the monitor to display a falsely elevated systolic pressure and a falsely low diastolic pressure. The hallmark diagnostic tool is the square wave test (also called the fast-flush test): after a brief flush, an underdamped system shows more than two oscillations before the waveform settles back to baseline. Fixing underdamping requires shortening the tubing, removing air bubbles, eliminating unnecessary stopcocks, and ensuring all connections are tight. The mean arterial pressure (MAP) typically remains accurate even when the waveform is distorted, which is why many clinicians rely on MAP rather than systolic and diastolic values when damping problems are suspected.
This matters beyond the ICU. The same resonance physics that distort invasive arterial lines also affect non-invasive photoplethysmography (PPG) signals. Understanding damping in one domain helps you interpret artifacts in the other. For a broader view of arterial line waveform interpretation, including overdamping and normal waveform anatomy, see our companion guide.
What Does an Underdamped Arterial Line Look Like?
Recognizing an underdamped waveform on the bedside monitor is the first step. The visual pattern is distinctive once you know what to look for.
Exaggerated systolic peak. The systolic pressure reading is artificially elevated, sometimes by 15 to 30 mmHg above the true value. The peak looks sharper and taller than it should. If a patient's cuff pressure reads 130/75 but the arterial line shows 160/60, underdamping should be high on the differential.
Artificially wide pulse pressure. Because systolic is pushed up and diastolic is pulled down, the pulse pressure (systolic minus diastolic) appears wider than reality. This can mimic the hemodynamic profile of aortic regurgitation or sepsis when neither condition is present.
Ringing after the systolic peak. This is the most characteristic feature. Instead of a smooth descent from the systolic peak through the dicrotic notch and into diastolic runoff, the waveform oscillates. You see one or more extra bumps on the descending limb that are not physiological. These oscillations are the monitoring system "ringing" at its natural frequency, much like a bell continues to vibrate after being struck.
Preserved or distorted dicrotic notch. The dicrotic notch may be obscured by the ringing oscillations, making it difficult to identify the true point of aortic valve closure. In some cases, the ringing itself may be mistaken for a dicrotic notch, leading to errors in waveform interpretation.
Accurate MAP. Despite the distortion of systolic and diastolic values, the mean arterial pressure is usually reliable because the area under the waveform curve (which determines MAP) is relatively preserved. This is a practical lifeline when you suspect underdamping but cannot fix it immediately.
Causes of Underdamping
The arterial line monitoring system is a second-order dynamic system with a natural frequency and a damping coefficient. Underdamping occurs when the damping coefficient is too low (below approximately 0.4) or when the natural frequency of the system drops into a range that overlaps with the harmonic content of the arterial waveform. Several physical factors contribute.
Excessive Tubing Length
Longer tubing lowers the natural frequency of the system. When the natural frequency drops below 25 Hz, it begins to overlap with the higher harmonics of the arterial pressure signal, and the system amplifies those frequency components. Standard practice limits tubing length to 120 cm (about 4 feet). Every extra extension, every added segment between catheter and transducer, pushes the natural frequency downward.
Stiff, Non-Compliant Tubing
This one is counterintuitive. Stiffer tubing actually raises the natural frequency (which is good), but if the tubing is stiff and the overall damping coefficient is very low, the system can ring freely with minimal energy dissipation. The ideal tubing is moderately compliant, enough to absorb some oscillatory energy without being so compliant that it overdamps the signal. Most purpose-built arterial line tubing sets are designed to hit this balance. Problems arise when non-standard tubing or extensions are used.
Small-Bore Catheters
A 20-gauge arterial catheter in an adult radial artery produces a system with lower damping than a 22-gauge catheter in a pediatric patient, all else being equal. Narrow-bore catheters in large arteries with high pulsatility can allow the system to ring more freely. The effect is modest compared to tubing length, but it contributes.
Excessive Stopcocks and Connectors
Each stopcock and Luer connection introduces a small dead space and a potential impedance mismatch. Three or more stopcocks in series measurably reduce the natural frequency and can shift the system toward underdamping. Remove any stopcocks that are not strictly necessary.
Tachycardia and High Cardiac Output States
A fast heart rate compresses the fundamental frequency of the arterial waveform upward, bringing it closer to the natural frequency of the monitoring system. In a patient with a heart rate of 140 and a borderline monitoring setup, tachycardia alone can push a marginally damped system into clinically significant underdamping. Similarly, high cardiac output states generate waveforms with more harmonic energy, giving the system more oscillatory energy to amplify.
Air Microbubbles (a Paradox)
Large air bubbles cause overdamping by increasing system compliance. But very small microbubbles can decrease damping by reducing the viscous resistance of the fluid column without adding enough compliance to offset the effect. This explains occasional cases where flushing the line temporarily worsens rather than improves the waveform.
The Square Wave Test: Diagnosing Underdamping at the Bedside
The square wave test, also known as the fast-flush test, is the standard bedside method for evaluating the dynamic response of an arterial line monitoring system. It takes about five seconds and requires no special equipment beyond the continuous flush device already built into the transducer setup.
How to Perform the Test
- Pull and hold the fast-flush valve (pigtail) for one to two seconds to deliver a square wave of pressure (approximately 300 mmHg from the pressurized flush bag) to the transducer.
- Release the valve quickly.
- Observe the waveform on the monitor as it transitions from the flat-topped square wave back to the arterial waveform.
Interpreting the Results
What you see after releasing the flush tells you the damping state of the system:
- Optimally damped (damping coefficient 0.5 to 0.7): The waveform drops sharply from the square wave, shows one to two small oscillations, and then quickly settles into the normal arterial tracing. This is the target.
- Underdamped (damping coefficient below 0.4): The waveform shows more than two oscillations after the square wave before settling. The oscillations may be tall and ring for several cycles. The more oscillations you count, the more underdamped the system is.
- Overdamped (damping coefficient above 0.7): The waveform drops slowly from the square wave with no oscillations, or with a single rounded oscillation that does not cross the baseline. It sluggishly returns to the arterial tracing.
Gardner (1981) established the clinical framework for this test, showing that the fast-flush test reliably categorizes arterial monitoring systems and that optimal damping requires both an adequate natural frequency and an appropriate damping coefficient (DOI: 10.1097/00003246-198110000-00006). This paper remains a foundational reference for understanding invasive pressure monitoring dynamics.
Quantitative Assessment
For a more precise evaluation, you can measure the natural frequency and damping coefficient from the square wave test tracing. The natural frequency equals 1 divided by the period of the oscillations. The damping coefficient can be estimated from the amplitude ratio of successive oscillations using logarithmic decrement formulas. In practice, most clinicians use the visual "count the oscillations" approach, which is sufficient for clinical decisions.
Step-by-Step Fix for an Underdamped Arterial Line
When the square wave test confirms underdamping, work through the following steps systematically.
- Shorten the tubing. Remove any extensions or unnecessary tubing segments. Keep the total tubing length under 120 cm from catheter to transducer. This is the single most effective intervention.
- Remove unnecessary stopcocks. Each stopcock you remove improves the dynamic response. Keep only what is needed for zeroing, blood sampling, and the flush device.
- Tighten all connections. Loose Luer connections introduce compliance and dead space. Check each junction from catheter to transducer.
- Flush the system thoroughly. Remove any air, microbubbles, or blood from the tubing. Use a syringe flush rather than the slow continuous flush to clear persistent bubbles.
- Add a damping device if available. Commercial arterial line damping devices (such as the Accudynamic or Rose damping chamber) introduce controlled compliance into the system to increase the damping coefficient without significantly lowering the natural frequency. These are effective when tubing length cannot be shortened further.
- Re-run the square wave test. Confirm that oscillations are reduced to one or two cycles. If underdamping persists despite all interventions, document it and rely on MAP for clinical decisions.
- Consider the clinical context. If the patient is tachycardic, the underdamping may partially resolve when the heart rate decreases.
How PPG Signals Show Similar Resonance Behavior
The physics of resonance and damping are not confined to fluid-filled tubing. PPG signals, captured by shining light through tissue and measuring the pulsatile changes in absorption, are subject to their own forms of ringing and artifact that parallel what happens in underdamped arterial lines.
Motion Artifact as PPG "Ringing"
When a finger clip pulse oximeter or wrist-worn PPG sensor experiences motion, the signal develops oscillatory distortions that look remarkably similar to the ringing seen in underdamped arterial lines. The mechanism is different (mechanical displacement of tissue and sensor rather than fluid column resonance), but the waveform effect is analogous: extra oscillations superimposed on the true pulsatile signal, exaggerated peaks, distorted troughs, and difficulty identifying the dicrotic notch. For a detailed taxonomy of these artifacts, see our guide to PPG noise types and classification.
Sensor-Tissue Coupling Resonance
The mechanical interface between a PPG sensor and the skin has its own resonant properties. A loosely attached sensor can vibrate at a characteristic frequency when the patient moves, producing periodic artifact that may be mistaken for physiological signal content. This is directly analogous to the natural frequency resonance of an arterial line system. Tighter sensor coupling increases damping of this mechanical resonance, just as adding a damping device increases damping in an arterial line.
Optical Path Resonance in Transmission PPG
In transmission-mode PPG (such as fingertip pulse oximetry), venous blood pooling and tissue compression can create a compliant chamber that oscillates in response to arterial pulsations. Allen (2007) described how these optical and mechanical properties of the PPG measurement site affect waveform fidelity and introduce distortions analogous to pressure monitoring system artifacts (DOI: 10.1088/0967-3334/28/3/R01). The PPG waveform basics guide covers the foundational signal morphology that these artifacts distort.
Why This Cross-Domain Understanding Matters
Clinicians who understand underdamping in arterial lines are better equipped to recognize analogous artifacts in PPG signals. Researchers developing PPG-based blood pressure algorithms must account for resonance-like distortions in both the reference arterial line signal and the PPG signal being calibrated against it. If the arterial line reference is underdamped during calibration, the algorithm learns to reproduce the artifact rather than the true blood pressure. For a direct comparison of how arterial blood pressure and PPG waveforms relate, see our PPG vs ABP comparison.
Clinical Impact of Ignoring Underdamping
Unnecessary treatment of "hypertension." A falsely elevated systolic reading may prompt antihypertensives or increased vasodilator infusions, causing iatrogenic hypotension when the true systolic pressure is normal.
Incorrect hemodynamic profiling. The widened pulse pressure from underdamping mimics high-output states, aortic regurgitation, or septic vasodilation. This may lead to unnecessary investigations or misguided fluid management.
Algorithmic errors. Electronic medical record systems and decision-support tools that ingest arterial line data directly may generate alerts and dosing recommendations based on artifactual values.
Frequently Asked Questions
How do I tell the difference between an underdamped arterial line and true systolic hypertension?
Perform the square wave test. If it shows more than two oscillations, the system is underdamped and the systolic reading is unreliable. You can also compare the arterial line systolic value to a non-invasive blood pressure cuff reading. If the arterial line reads 20 or more mmHg above the cuff, underdamping is likely contributing. Check the MAP on both devices; if the MAPs agree but the systolic values diverge, the arterial line system dynamics are the probable cause.
What is the ideal number of oscillations on a square wave test?
One to two oscillations after releasing the fast flush, followed by a rapid return to the arterial waveform, indicates optimal damping. Zero oscillations (or a slow, rounded return) suggests overdamping. More than two oscillations indicates underdamping. The oscillations should decrease in amplitude rapidly; if they persist at a similar height for three or more cycles, the system is significantly underdamped.
Can I just use MAP instead of fixing the underdamped line?
Yes, as a short-term strategy. MAP is relatively preserved during underdamping because the area under the waveform curve remains approximately correct even when the peak and trough are distorted. However, relying on MAP alone means losing the clinical information encoded in the systolic and diastolic values, pulse pressure, and waveform morphology. Fix the line when possible, and use MAP as a bridge while troubleshooting.
Does air in the tubing cause underdamping or overdamping?
It depends on the size of the air bubble. Large air bubbles (visible segments of air in the tubing) cause overdamping by adding compliance to the system, which absorbs pressure energy and blunts the waveform. Very small microbubbles, however, can reduce the viscous damping of the fluid column without adding significant compliance, pushing the system toward underdamping. In practice, any visible air in the tubing should be flushed out regardless, because both overdamping and underdamping degrade signal quality.
How does underdamping in an arterial line relate to motion artifact in PPG?
Both involve oscillatory energy being added to the true physiological signal. In an arterial line, the fluid-filled tubing system resonates at its natural frequency. In PPG, mechanical motion adds oscillatory components to the optical signal. The distortions look similar: exaggerated peaks, extra bumps on the descending limb, and a hard-to-find dicrotic notch. The fix shares a common principle too. In arterial lines you increase damping; in PPG you improve sensor fixation and apply signal filtering.
What is the minimum natural frequency needed for accurate arterial pressure monitoring?
At least 25 Hz. The fundamental frequency of the arterial pulse at a heart rate of 120 bpm is 2 Hz, but accurate waveform reproduction (including the dicrotic notch and systolic peak) requires capturing harmonics up to approximately the 10th harmonic, which is 20 Hz at that heart rate. A natural frequency of 25 Hz or higher provides adequate headroom.
Should I use a damping device on every arterial line setup?
Not routinely. Most properly assembled setups with standard-length tubing and minimal stopcocks achieve adequate damping without one. Damping devices are useful when the system remains underdamped despite optimizing tubing length and connections, which tends to occur in pediatric setups with small-bore catheters or in patients requiring long tubing runs.