PPG vs Abp Comparison
The photoplethysmographic (PPG) waveform and the arterial blood pressure (ABP) waveform are intimately related but fundamentally different measurement...
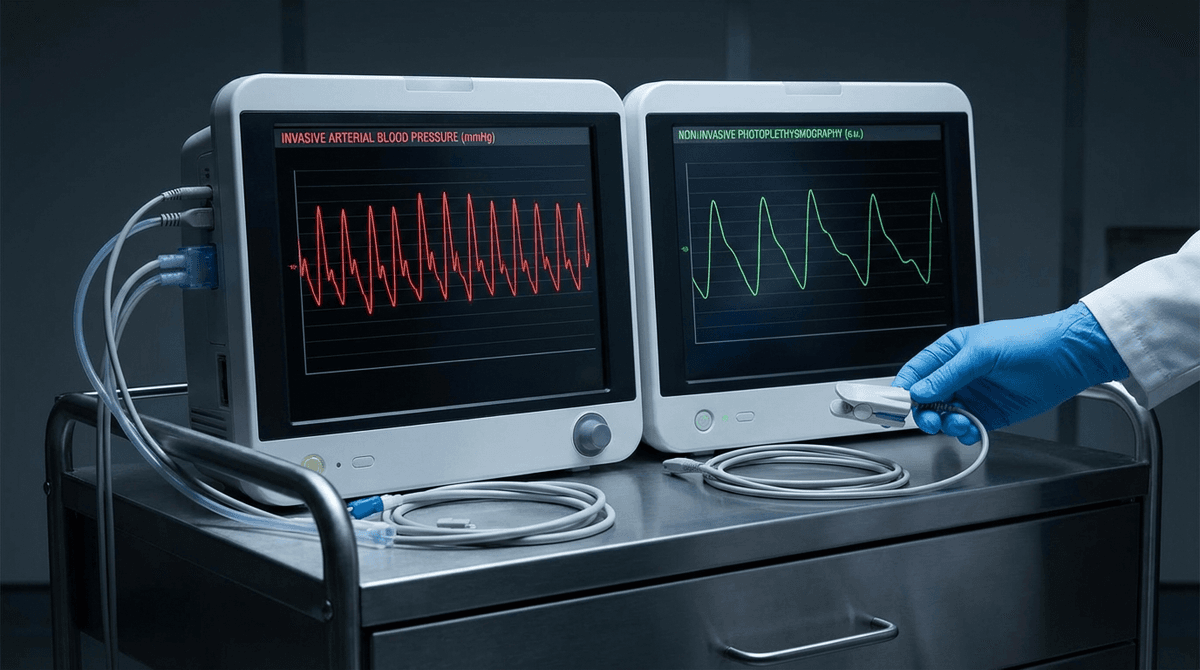
The photoplethysmographic (PPG) waveform and the arterial blood pressure (ABP) waveform are intimately related but fundamentally different measurements of the same underlying cardiovascular event. ABP directly measures the pressure exerted by blood on the arterial wall, captured either invasively through an arterial catheter or non-invasively through tonometry. PPG measures the volumetric change in blood within the microvascular bed, captured optically through light absorption changes. Understanding how these two signals relate to each other, where they agree, and where they diverge, is essential for anyone working on cuffless blood pressure estimation, pulse wave analysis, or cardiovascular monitoring systems.
This article provides a rigorous technical comparison of the two waveforms, covering their physiological origins, morphological differences, mathematical relationships, and the practical implications for PPG-based blood pressure research.
Physiological Origins of Each Signal
Arterial Blood Pressure Waveform
The ABP waveform originates from the pulsatile ejection of blood from the left ventricle into the aorta. During systole, the left ventricle generates a pressure wave that propagates through the arterial tree at a velocity of 4-12 m/s (depending on arterial stiffness and vessel diameter). The pressure waveform at any point in the arterial tree is the superposition of the forward-traveling ejection wave and backward-traveling reflected waves from impedance mismatches at arterial bifurcations and the peripheral resistance bed.
The gold-standard ABP measurement uses an intra-arterial catheter connected to a pressure transducer, typically placed in the radial, femoral, or brachial artery. This provides continuous, beat-to-beat pressure measurement with bandwidth extending from DC to approximately 40 Hz (sufficient to capture the first 10-15 harmonics of the pressure pulse). The pressure range spans from diastolic (typically 60-90 mmHg) to systolic (typically 90-140 mmHg), with mean arterial pressure approximately equal to diastolic pressure plus one-third of the pulse pressure.
Non-invasive ABP measurement via applanation tonometry (using devices like the SphygmoCor system) captures the pressure waveform from superficial arteries (radial, carotid) by flattening the artery against underlying bone. Tonometry provides morphologically accurate waveforms but requires a trained operator and cannot measure absolute pressure without calibration against a cuff measurement.
PPG Waveform
The PPG waveform reflects blood volume changes in the microvasculature at the measurement site (fingertip, wrist, earlobe). The signal is generated by the interaction of light with the tissue, where changes in the volume of arterial blood modulate light absorption according to the Beer-Lambert law. Unlike ABP, which measures in large arteries (diameter 2-5 mm), PPG measures in arterioles (diameter 10-100 micrometers) and capillaries (diameter 5-10 micrometers).
The PPG signal contains a pulsatile AC component (typically 0.5-5% of the total signal) superimposed on a large DC baseline. The AC component reflects arterial pulsations, while the DC component reflects tissue absorption, venous blood volume, and non-pulsatile arterial blood. The presence of venous and capillary contributions is a fundamental difference from ABP, which measures only arterial pressure.
For a complete treatment of PPG signal generation and its optical foundations, see our photoplethysmography guide.
Waveform Morphology: Detailed Comparison
Systolic Phase
Both waveforms show a rapid upstroke during systole, but with notable differences. The ABP systolic upstroke is sharper and faster, reaching peak pressure in approximately 80-120 ms from the pulse onset. The PPG systolic upstroke is slightly slower and more rounded, reaching peak volume in 100-200 ms. This difference arises because the arterial tree acts as a low-pass filter: high-frequency pressure oscillations in the aorta are progressively attenuated as the pulse wave travels to the peripheral microvasculature where PPG measures.
The systolic peak amplitude in ABP has direct physiological meaning (systolic blood pressure in mmHg). The systolic peak amplitude in PPG is in arbitrary units (proportional to blood volume change times light absorption coefficient) and depends on sensor placement, contact pressure, LED intensity, and photodetector gain. This lack of absolute calibration is the fundamental challenge for PPG-based blood pressure estimation.
Dicrotic Notch and Reflected Waves
The dicrotic notch, caused by aortic valve closure and the resulting pressure wave reflection, is a prominent feature of the ABP waveform in young, healthy individuals. In the central aortic pressure waveform, the notch appears as a sharp downward deflection followed by a brief pressure increase (the dicrotic wave). As the measurement site moves peripherally (from aorta to radial to digital artery), the dicrotic notch position changes due to pressure wave amplification and reflection effects.
In PPG, the dicrotic notch is often attenuated or absent, particularly in older adults and those with increased arterial stiffness. Millasseau et al. (2006; DOI: 10.1038/sj.jhh.1001860) demonstrated that the PPG dicrotic notch visibility decreases significantly with age and is absent in approximately 30% of subjects over 60 years old. When present, the PPG dicrotic notch occurs later in the cardiac cycle than the ABP dicrotic notch at the same site because the volume pulse lags the pressure pulse (volume changes follow pressure changes through the compliance relationship).
Diastolic Phase
The diastolic decay in ABP follows an approximately exponential pattern characterized by the Windkessel time constant (the product of total peripheral resistance and arterial compliance). In large arteries, this decay is relatively smooth. In PPG, the diastolic phase can show more complex morphology, including secondary reflections and oscillations from the microvascular bed. The diastolic PPG waveform is also influenced by venous return and respiratory variations to a greater extent than ABP.
The Pressure-Volume Relationship
The mathematical relationship between arterial pressure and blood volume (and therefore between ABP and PPG) is fundamentally nonlinear. This nonlinearity is one of the most important factors distinguishing the two waveforms.
Arterial Compliance
Arterial compliance (C = dV/dP) describes how much the arterial volume changes for a given change in pressure. In large arteries, compliance is relatively high (approximately 1-2 mL/mmHg for the entire aorta) and decreases with increasing pressure due to the nonlinear stress-strain properties of the arterial wall (collagen fibers progressively recruited at higher pressures). In small arterioles and capillaries where PPG measures, compliance is much lower and more pressure-dependent.
This means the PPG waveform is a distorted version of the ABP waveform, with the distortion dependent on the operating pressure. At higher mean pressures, compliance is lower, so the same pressure pulse produces a smaller volume change and a smaller PPG pulse amplitude. Conversely, at lower pressures, greater compliance amplifies the volume response to pressure changes. This nonlinear relationship is described mathematically by the arterial tube law or exponential pressure-area models (Bramwell & Hill, 1922).
Transfer Function Modeling
Researchers have attempted to characterize the ABP-to-PPG transfer function using various approaches:
Linear autoregressive (AR) models: Alastruey et al. (2008; DOI: 10.1016/j.jbiomech.2008.05.016) used AR models of order 10-20 to predict finger PPG from radial ABP, achieving normalized mean squared errors of 15-25%. The transfer function exhibits low-pass characteristics with a -3 dB cutoff frequency of approximately 8-12 Hz.
Windkessel models: Lumped-parameter models representing arterial segments as resistor-capacitor-inductor circuits can predict the PPG waveform from aortic pressure with reasonable accuracy for the fundamental frequency and first 3-5 harmonics. Three-element and four-element Windkessel models (Westerhof et al., 2009; DOI: 10.1007/s11517-008-0359-2) capture the basic pressure-volume dynamics but miss higher-frequency waveform details.
Distributed transmission line models: One-dimensional models of the arterial tree can simulate pulse wave propagation from the aorta to the peripheral measurement site, accounting for wave reflection, tapering, and branching. These models predict both the ABP and (through compliance relationships) the PPG waveform with good fidelity (Reymond et al., 2009).
Pulse Wave Analysis: Extracting Vascular Information
Both ABP and PPG waveforms can be analyzed to extract indices of cardiovascular health, but the accuracy and interpretation differ between modalities.
Augmentation Index (AIx)
The augmentation index quantifies the contribution of reflected pressure waves to the systolic pressure peak. From ABP, AIx is defined as the ratio of augmentation pressure (the difference between the systolic peak and the inflection point marking the arrival of the reflected wave) to pulse pressure. Central (aortic) AIx measured by tonometry with a validated transfer function is a well-established marker of arterial stiffness and cardiovascular risk.
From PPG, AIx can be estimated but requires careful interpretation. Brillante et al. (2008) compared PPG-derived AIx from the finger with carotid tonometry-derived AIx and found correlations of r = 0.65-0.78. The weaker correlation compared to radial tonometry arises because the finger PPG waveform undergoes additional vascular filtering and the pressure-volume nonlinearity alters the apparent augmentation.
Stiffness Index and Reflection Index
The digital volume pulse (DVP) from finger PPG can be decomposed into a direct systolic component and a reflected diastolic component. Two indices derived from this decomposition have been widely studied:
Stiffness Index (SI): Calculated as body height divided by the time delay between the systolic and diastolic peaks of the DVP. SI correlates with aortic pulse wave velocity (PWV) at r = 0.55-0.72 (Millasseau et al., 2002; DOI: 10.1161/01.HYP.0000037965.68991.F8). Aortic PWV measured by carotid-femoral tonometry is the gold standard for arterial stiffness assessment, and PPG-derived SI provides a simplified proxy that can be obtained with a standard finger pulse oximeter.
Reflection Index (RI): Calculated as the ratio of the diastolic peak amplitude to the systolic peak amplitude of the DVP. RI reflects the magnitude of the reflected wave relative to the incident wave and correlates with peripheral vascular resistance and endothelial function.
For broader context on how these vascular metrics relate to PPG algorithms, see our algorithms overview.
Cuffless Blood Pressure Estimation from PPG
The ultimate goal of understanding the PPG-ABP relationship is to enable non-invasive, continuous blood pressure estimation from PPG alone. Several approaches have been pursued, each with distinct technical foundations and accuracy limitations.
Pulse Transit Time Methods
PTT-based methods exploit the inverse relationship between pulse wave velocity (and therefore transit time) and blood pressure, derived from the Moens-Korteweg equation. These methods require either a simultaneous ECG signal (to measure pulse arrival time) or two PPG sensors at different body locations (to measure PTT directly).
Chen et al. (2000; DOI: 10.1109/TBME.2002.803679) established the logarithmic relationship between PTT and systolic BP, achieving calibrated estimation errors of approximately 5 mmHg standard deviation in controlled laboratory conditions. However, the relationship requires individual calibration, drifts over time due to vascular tone changes, and is confounded by pre-ejection period variability when using PAT instead of true PTT.
Waveform Feature Methods
These methods extract morphological features from the PPG pulse waveform (systolic upslope time, pulse width at various amplitudes, diastolic decay time, area ratios) and use regression or machine learning to map features to blood pressure. El-Hajj and Kyriacou (2020; DOI: 10.1016/j.bspc.2020.101870) reviewed 58 studies using PPG features for BP estimation and found reported errors ranging from 3 to 15 mmHg (standard deviation) across studies, with significant heterogeneity in validation methodology.
A critical limitation of feature-based methods is their sensitivity to waveform quality. Motion artifact, poor perfusion, and probe contact variations can alter extracted features in ways that mimic blood pressure changes, causing false readings. The motion artifact removal pipeline is therefore a prerequisite for reliable PPG-based BP estimation.
Deep Learning Approaches
End-to-end deep learning models that take raw PPG waveforms as input and predict systolic and diastolic pressure as output have shown promising results on retrospective datasets. Slapnicar et al. (2019; DOI: 10.3390/s19153420) used a spectro-temporal ResNet architecture on the MIMIC-III waveform database and reported mean absolute errors of 9.43 mmHg for systolic and 6.88 mmHg for diastolic pressure.
However, these results must be interpreted cautiously. The MIMIC-III database contains simultaneously recorded PPG and ABP from ICU patients, a population with significantly more hemodynamic variability than the ambulatory population where cuffless BP would be most useful. Studies training and testing on the same patient data (even with train-test splits) often overestimate generalization accuracy due to patient-specific waveform characteristics that leak information across splits. Prospective validation in ambulatory settings consistently shows higher errors than retrospective database studies.
Regulatory Standards
For a PPG device to be marketed as a blood pressure monitor, it must meet accuracy standards defined by AAMI/ANSI/ISO 81060-2: mean error below 5 mmHg and standard deviation below 8 mmHg across a diverse population. As of 2026, no wrist-worn PPG-only device has received FDA clearance for blood pressure measurement as a primary indication, though several have received clearance for blood pressure trending or estimation with caveats. The regulatory pathway for these devices is discussed in our FDA regulatory guide.
Practical Implications for Device Design
Understanding the PPG-ABP relationship has direct implications for PPG sensor and algorithm design:
Sensor contact pressure: PPG waveform morphology changes with contact pressure because external pressure alters transmural pressure in the underlying vessels, shifting the operating point on the pressure-volume curve. Standardizing contact pressure (or measuring and compensating for it) is critical for consistent pulse wave analysis and BP estimation. Teng and Zhang (2006) showed that optimal contact pressure for finger PPG is approximately 60-80 mmHg, where transmural pressure is near zero and pulsatile signal amplitude is maximized.
Measurement site: The PPG-ABP transfer function varies significantly between body sites. Finger PPG shows the strongest morphological similarity to radial ABP because the digital artery is a direct downstream branch. Wrist PPG measures a different vascular bed (dorsal hand circulation) with different compliance and reflection characteristics. Ear PPG provides waveforms closer to central aortic pressure due to the shorter arterial path and fewer reflection sites.
Wavelength selection: Because the pressure-volume relationship is nonlinear, PPG wavelengths that probe different tissue depths (and therefore different vessel sizes with different compliance characteristics) produce waveforms with different morphological relationships to ABP. Infrared PPG, which penetrates deeper and measures larger arterioles, may provide waveforms more closely related to ABP than green PPG, which measures superficial capillaries. For wavelength selection considerations, see our wavelength comparison guide.
Sampling rate: ABP is typically sampled at 250-1000 Hz to capture the full waveform bandwidth. PPG sampling rates vary from 25 Hz (some consumer wearables) to 500 Hz (research devices). For accurate pulse wave analysis, PPG sampling rates of at least 100 Hz are recommended to preserve the dicrotic notch and other morphological features needed for waveform analysis (Elgendi, 2012; DOI: 10.1016/j.cmpb.2012.09.005).
Conclusion
The PPG and ABP waveforms are related through the arterial tree's transmission line properties and the nonlinear pressure-volume relationship of the vasculature. While both originate from the same cardiac event, they measure different physical quantities (volume vs. pressure) at different vascular scales (microvasculature vs. large arteries), producing waveforms that share overall morphological similarity but differ in fine detail. These differences are not merely academic: they define the fundamental accuracy limits of PPG-based blood pressure estimation and pulse wave analysis. Advances in transfer function modeling, deep learning, and multi-site PPG measurement continue to narrow the gap between PPG-derived and directly measured arterial pressure, but achieving clinical-grade accuracy from PPG alone remains one of the most challenging problems in cardiovascular bioengineering. For ongoing coverage of this rapidly evolving field, explore our learning resources and algorithm references.