Pulse Wave Analysis Using PPG: Waveform Features, Vascular Health, and Clinical Applications
Complete guide to pulse wave analysis from PPG signals. Covers augmentation index, stiffness index, derivatives, fiducial points, and vascular assessment.
Pulse wave analysis (PWA) is the systematic extraction and interpretation of features from the arterial pulse waveform to assess cardiovascular health. When applied to photoplethysmography (PPG) signals, pulse wave analysis transforms a simple optical trace into a window onto vascular stiffness, cardiac function, and peripheral resistance. Each PPG pulse contains a systolic component driven by left ventricular ejection and a diastolic component shaped by arterial compliance and wave reflections. The ratio, timing, and morphology of these components reveal information about arterial aging, blood pressure regulation, and cardiovascular disease risk that goes far beyond heart rate alone.
PPG-based pulse wave analysis has gained traction because the hardware is already everywhere. Every smartwatch, pulse oximeter, and smartphone camera that captures a PPG signal generates waveforms suitable for morphological analysis. The challenge is not acquiring the signal but knowing how to extract, quantify, and interpret the features it contains.
Anatomy of the PPG Pulse Wave
A single PPG pulse cycle corresponds to one cardiac cycle. Understanding its components requires tracing the path of the pressure wave from the heart to the sensor.
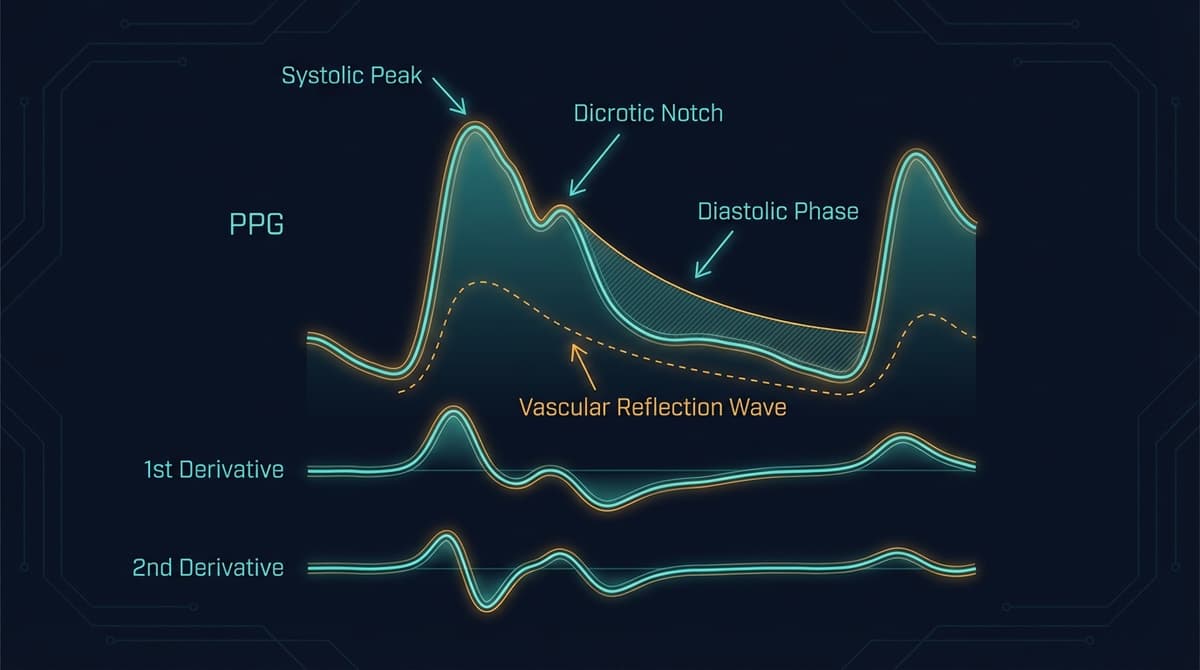
The systolic phase begins with left ventricular ejection. Blood is forced into the aorta, generating a forward-traveling pressure wave that propagates through the arterial tree. When this wave arrives at the PPG measurement site, it produces the systolic upstroke, the steep rising edge of the waveform. The rate of rise (dP/dt) reflects the speed and force of ventricular ejection and the compliance of the proximal arteries.
The systolic peak marks the maximum arterial distension at the measurement site. In young, healthy individuals with compliant arteries, this peak is well-defined and occurs relatively late in systole. In older individuals with stiff arteries, the peak may occur earlier and appear sharper.
The dicrotic notch appears on the descending limb, marking the approximate timing of aortic valve closure. In peripheral PPG signals, the notch is smoothed compared to central aortic pressure tracings but remains identifiable in high-quality recordings. Its depth and timing encode information about aortic valve competence and arterial compliance.
The diastolic component follows the dicrotic notch. It represents the combined effects of arterial recoil (the Windkessel function), ongoing forward flow from elastic energy stored in the arterial walls, and reflected waves returning from peripheral reflection sites. The diastolic decay rate reflects total peripheral resistance.
The reflected wave is often the most informative component for vascular assessment. When the forward-traveling pressure wave encounters impedance mismatches (branch points, areas of increased stiffness, arterioles), a portion of the wave energy reflects back toward the heart. In young people with compliant arteries, the reflected wave arrives during diastole and augments diastolic pressure, which benefits coronary perfusion. In older individuals or those with stiff arteries, the reflected wave arrives earlier, during late systole, augmenting systolic pressure and increasing cardiac workload.
Key Indices from PPG Pulse Wave Analysis
Augmentation Index (AIx)
The augmentation index quantifies the contribution of reflected waves to the systolic portion of the pulse waveform. It is defined as:
AIx = (P2 - P1) / PP x 100%
Where P1 is the first systolic shoulder (forward wave peak), P2 is the late systolic peak (augmented by the reflected wave), and PP is pulse pressure (systolic minus diastolic pressure). When the reflected wave arrives during systole, P2 exceeds P1 and AIx is positive, indicating systolic augmentation from wave reflections.
In young healthy adults, AIx from peripheral PPG is typically negative or near zero (the reflected wave arrives after the systolic peak). By age 60-70, AIx is typically positive and increasing. Each 10% increase in AIx corresponds to a measurable increase in cardiovascular risk.
PPG-derived AIx correlates with tonometry-derived central AIx (r = 0.65-0.85 depending on measurement site and methodology), though the absolute values differ because peripheral amplification modifies the waveform shape. For a detailed analysis, see our guide to PPG augmentation index.
Stiffness Index (SI)
The stiffness index estimates pulse wave velocity through the large arteries using a single PPG sensor. It is calculated as:
SI = body height / delta_T
Where delta_T is the time delay between the systolic peak and the diastolic peak (or the inflection point of the reflected wave component). The rationale: the time between the forward and reflected components depends on the round-trip transit time to the major reflection site (typically the aortic bifurcation), which is proportional to body height and inversely proportional to pulse wave velocity. Higher SI values indicate stiffer arteries.
Millasseau et al. (2002) validated SI against carotid-femoral pulse wave velocity in 87 subjects, finding a correlation of r = 0.65 (DOI: 10.1042/cs1030371). Normal values for SI range from approximately 5-7 m/s in young adults to 8-12 m/s in elderly individuals.
Reflection Index (RI)
The reflection index quantifies the magnitude of the reflected wave relative to the forward wave:
RI = diastolic peak amplitude / systolic peak amplitude x 100%
RI provides information about peripheral vascular resistance and the intensity of wave reflections. Higher RI values suggest greater impedance mismatch or more intense peripheral reflection. RI decreases with vasodilation (as during reactive hyperemia testing) and increases with vasoconstriction.
Crest Time and Crest Time Ratio
Crest time is the interval from the foot of the pulse wave to the systolic peak. Crest time ratio normalizes this by the total pulse duration:
CT ratio = crest time / pulse period
Shorter crest times indicate stiffer proximal arteries (the pressure wave arrives faster). CT ratio below 0.20 is associated with increased arterial stiffness in subjects over 50, while values above 0.30 are typical in young, healthy adults.
Large Artery Stiffness Index (LASI) and Small Artery Stiffness Index (SASI)
These indices, derived from the second derivative of the PPG waveform (SDPPG), separate the contributions of large and small artery stiffness. LASI relates to the timing and amplitude of the early systolic components, while SASI relates to the late systolic and early diastolic components. For details on SDPPG analysis, see our dedicated second derivative PPG guide.
Derivative Analysis: First and Second Derivatives
Taking the first and second derivatives of the PPG signal amplifies rapid changes in the waveform and makes fiducial point detection more robust.
First Derivative (VPG - Velocity Plethysmogram)
The first derivative of the PPG represents the rate of change of blood volume, analogous to blood flow velocity. It converts peaks in the PPG into zero crossings, and inflection points into peaks or troughs. The maximum of the first derivative corresponds to the maximum rate of rise of the systolic upstroke and is strongly correlated with the rate of ventricular ejection.
Key features of the VPG:
- Maximum positive peak (w): Corresponds to the steepest part of the systolic upstroke. Its amplitude correlates with left ventricular ejection force and proximal arterial compliance.
- Zero crossing: Marks the systolic peak of the original PPG.
- Minimum (negative peak): Corresponds to the fastest diastolic descent.
- Second zero crossing: Marks the diastolic minimum.
Second Derivative (SDPPG - Acceleration Plethysmogram)
The second derivative is the most widely used derivative for clinical pulse wave analysis. Takazawa et al. (1998) identified five characteristic waves in the SDPPG, labeled a through e (DOI: 10.1038/hr.1998.32):
- a wave: Initial positive wave, reflecting the early systolic acceleration of blood flow. Corresponds to the rising phase of the systolic pulse.
- b wave: Initial negative wave, reflecting the deceleration of early systolic flow. Related to large artery compliance.
- c wave: Second positive wave (re-acceleration), often attributed to the reflected wave component.
- d wave: Second negative wave, related to the dicrotic notch and aortic valve closure.
- e wave: Late positive wave in diastole, related to diastolic wave reflection.
The ratios of these waves provide clinically validated indices:
- b/a ratio: Increases with arterial stiffness. In Takazawa's original study of 600 subjects, b/a correlated with age (r = 0.72) and with brachial-ankle PWV (r = 0.55). Higher b/a indicates stiffer arteries.
- c/a ratio: Reflects the amplitude of the reflected wave component relative to the forward wave.
- d/a ratio: Related to diastolic function and peripheral resistance. Lower d/a is associated with increased vascular tone.
- e/a ratio: Related to diastolic wave reflection.
- Aging index (AGI): Defined as (b - c - d - e) / a. This composite index increases approximately linearly with age in healthy individuals, providing a single metric for vascular aging.
Fiducial Point Detection Methods
Extracting pulse wave features requires reliable identification of fiducial points, the characteristic landmarks on the waveform.
Foot detection (the onset of the systolic upstroke) is the most fundamental fiducial point. Common methods include:
- Intersecting tangent method: Fit tangent lines to the baseline and the steepest part of the upstroke; the foot is their intersection.
- Maximum second derivative: The foot corresponds to the maximum of the second derivative preceding the systolic peak.
- Threshold method: The foot is the point where the signal exceeds a fixed percentage (typically 10-20%) of the pulse amplitude.
Systolic peak detection is typically performed using first derivative zero-crossing detection with amplitude thresholds to avoid detecting noise.
Dicrotic notch detection is more challenging because the notch is often subtle or absent in peripheral PPG. Methods include:
- Second derivative analysis (the notch appears as a local minimum in the second derivative)
- Fitting a parametric model to the diastolic decline and identifying deviations
- Using the third derivative to identify the inflection point
Reflected wave onset can be estimated using Gaussian decomposition, where the PPG pulse is modeled as the sum of two or three Gaussian functions representing the forward and reflected wave components. The parameters of these Gaussians (timing, amplitude, width) provide the features for wave analysis.
For a comprehensive overview of PPG waveform morphology features, see our PPG morphology features guide.
Measurement Site Differences: Finger vs. Ear vs. Wrist
PPG waveform morphology varies substantially across measurement sites, and pulse wave analysis must account for these differences.
Finger PPG provides the highest amplitude signal with the most pronounced waveform features. The finger has dense arterial-venous anastomoses and strong sympathetic innervation, which means the signal is highly responsive to autonomic changes. However, finger PPG is also the most susceptible to temperature-dependent vasoconstriction. Finger PPG typically shows a well-defined dicrotic notch and clear separation between systolic and reflected wave components.
Ear (earlobe or tragus) PPG is less affected by sympathetic vasoconstriction because the ear vasculature has minimal autonomic innervation. This makes ear PPG more stable during cold exposure or sympathetic activation. However, the ear waveform has lower amplitude and less pronounced morphological features, particularly the dicrotic notch, which is often absent. The ear is closer to the central circulation, so the waveform more closely resembles the aortic pulse with less peripheral amplification.
Wrist (radial artery) PPG from smartwatches typically has the lowest signal quality for pulse wave analysis. The radial artery sits deeper beneath the skin surface, the sensor-skin contact is less stable, and motion artifacts from wrist movement are prevalent. Waveform features like the dicrotic notch are frequently undetectable in wrist PPG, which limits the applicability of many traditional PWA indices. However, wrist PPG captures cardiac timing information reliably, allowing heart rate variability and basic pulse timing analysis.
Forehead PPG is used in some clinical monitoring scenarios. Like the ear, the forehead has limited sympathetic vasoconstriction and provides stable perfusion during hemodynamic compromise. Its pulse wave morphology is intermediate between ear and finger in feature clarity.
The choice of measurement site determines which PWA indices can be reliably extracted. Stiffness index and crest time can typically be obtained from finger, ear, and wrist sites. Augmentation index and reflection index require clear identification of the reflected wave component, which limits them primarily to finger PPG and high-quality ear PPG.
Clinical Applications and Vascular Health Assessment
PPG pulse wave analysis has been validated for several clinical applications:
Vascular age estimation. The SDPPG aging index (AGI) increases approximately linearly with age in healthy individuals, but accelerates in those with cardiovascular risk factors. The difference between SDPPG-derived vascular age and chronological age provides a measure of vascular health. Subjects with diabetes, hypertension, or dyslipidemia show vascular ages 5-15 years ahead of their chronological age. For more on this application, see our PPG vascular age assessment guide.
Arterial stiffness screening. The stiffness index provides a non-invasive, single-site estimate of aortic stiffness that can be obtained from a finger PPG clip in under 30 seconds. While less accurate than carotid-femoral PWV, it is practical for population screening.
Endothelial function testing. Reactive hyperemia following brief arterial occlusion (typically 5 minutes of brachial artery occlusion with a BP cuff) causes flow-mediated changes in the PPG waveform. The degree of change in RI, SI, and pulse amplitude provides an index of endothelial function analogous to flow-mediated dilation (FMD) measured by ultrasound.
Drug response monitoring. Vasodilators (nitroglycerin, sildenafil) produce characteristic changes in PWA indices: decreased AIx, decreased SI, and increased RI. These changes can be tracked in real time using continuous PPG monitoring, providing a non-invasive method for assessing drug effects.
Perioperative monitoring. Changes in PPG waveform morphology during anesthesia reflect the hemodynamic effects of anesthetic agents. Decreased pulse amplitude and altered AIx may signal excessive vasodilation or volume depletion before changes in blood pressure become apparent.
Limitations and Challenges
PPG pulse wave analysis faces several limitations that researchers and clinicians should understand.
Signal quality dependence. Most PWA indices require clean, artifact-free waveforms. Even minor motion artifacts distort the dicrotic notch and reflected wave components, rendering AIx and RI unreliable. Automated signal quality assessment is essential before applying PWA algorithms.
Heart rate dependence. AIx is strongly heart rate-dependent: a 10 bpm increase in heart rate reduces AIx by approximately 4-5%. Normalization to a standard heart rate (typically 75 bpm) using published correction equations is necessary for meaningful comparisons across subjects or time points.
Age and sex effects. PWA indices change substantially with age, and women show consistently higher AIx values than men at all ages (approximately 5-10% higher). Reference ranges must be stratified by age and sex.
Calibration to central pressure. Peripheral PPG waveforms are amplified and distorted compared to central aortic waveforms due to peripheral amplification. Transfer functions can be used to estimate central waveform features from peripheral recordings, but these transfer functions are not universally accurate across all patient populations.
Reproducibility. Test-retest variability for PPG-derived PWA indices is higher than for tonometry-based measurements. Coefficients of variation of 8-15% are typical for finger PPG SI and AIx, compared to 5-8% for applanation tonometry.
Frequently Asked Questions
What does pulse wave analysis tell you about your health?
Pulse wave analysis reveals how stiff or compliant your arteries are, how strongly pressure waves reflect from peripheral blood vessels, and how hard your heart has to work against these reflections. These features change with aging, hypertension, diabetes, and other cardiovascular risk factors. Abnormal pulse wave features often appear years before clinical disease, making PWA useful for early risk detection.
Can a smartwatch perform pulse wave analysis?
Smartwatches can extract some basic pulse wave features from wrist PPG, including heart rate, pulse timing, and rough estimates of pulse wave velocity. However, advanced morphological features like the augmentation index and reflection index require clearer waveforms than most wrist-worn devices provide. Finger-based PPG devices offer better signal quality for comprehensive pulse wave analysis.
What is the difference between the stiffness index and pulse wave velocity?
The stiffness index estimates PWV from a single PPG sensor by measuring the time delay between forward and reflected wave components within one pulse cycle. True PWV measurement requires two sensors at known arterial sites (such as carotid and femoral). SI and PWV correlate (r = 0.65) but are not interchangeable because SI depends on assumptions about the reflection site location and body height.
How does age affect PPG pulse wave morphology?
Young, healthy arteries are elastic, which delays the return of reflected waves to diastole and produces a clear dicrotic notch and distinct systolic and diastolic peaks. With aging, arteries stiffen, reflected waves arrive earlier (during systole), the dicrotic notch flattens, and the waveform becomes more triangular with a single dominant peak. The SDPPG aging index tracks these changes quantitatively.
What is the second derivative of PPG used for?
The second derivative (SDPPG or acceleration plethysmogram) amplifies subtle waveform features that are difficult to see in the raw PPG. It produces five characteristic waves (a through e) whose amplitude ratios correlate with arterial stiffness, vascular age, and cardiovascular risk. The b/a ratio and the aging index (b-c-d-e)/a are the most widely used SDPPG metrics.
Does blood pressure affect pulse wave analysis results?
Yes. Higher blood pressure increases arterial stiffness and speeds wave reflection, which increases the augmentation index and stiffness index. Antihypertensive drugs that reduce arterial stiffness (such as ACE inhibitors and calcium channel blockers) produce measurable changes in PWA indices. However, PWA indices are not direct measures of blood pressure. They reflect the structural and functional state of the arterial wall.
How reliable is finger PPG for pulse wave analysis compared to tonometry?
Finger PPG pulse wave analysis shows moderate to good agreement with radial artery tonometry for most indices. Correlations of r = 0.70-0.85 are typical for stiffness index and augmentation index. The main limitations are higher variability (8-15% CV vs. 5-8% for tonometry) and sensitivity to temperature-induced vasoconstriction. Finger PPG is considered suitable for population studies and screening, while tonometry remains preferred for clinical decision-making.