PPG Reading Interpretation Guide: Normal Waveforms, Abnormal Patterns, and Signal Quality
Learn how to interpret a PPG reading. Covers normal waveform patterns, abnormal signals, AC/DC components, dicrotic notch, and signal quality assessment.
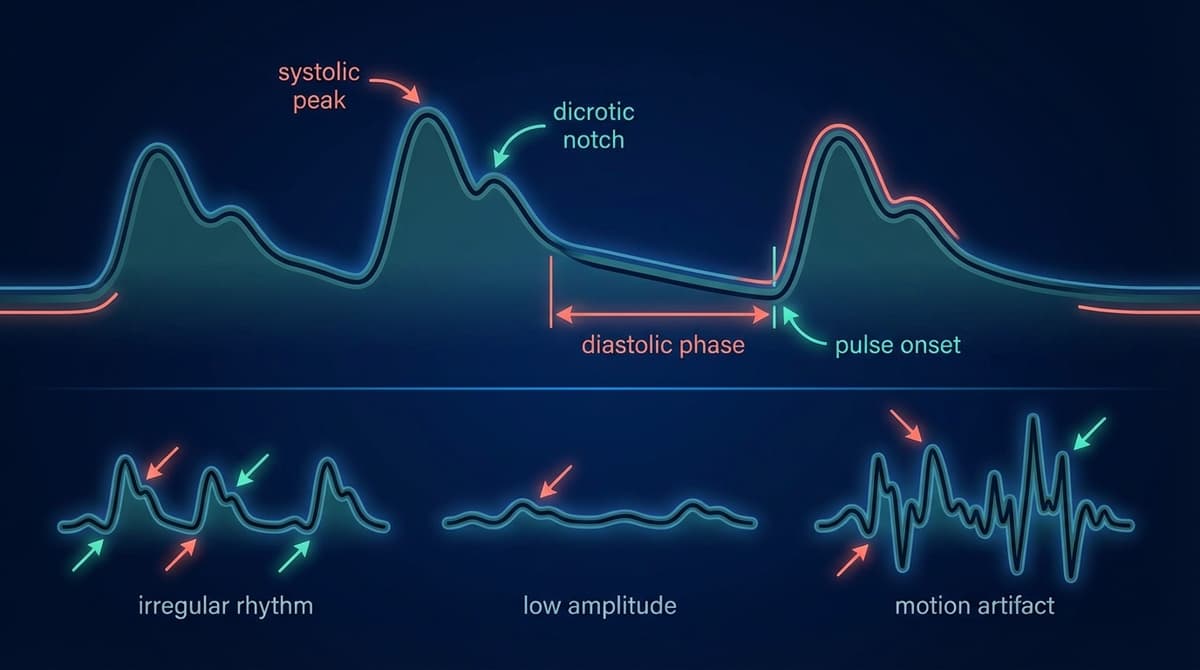
A PPG reading shows the volumetric changes in blood flow through tissue with each heartbeat, captured as a continuous optical signal. A normal PPG waveform has a smooth, repeating pulse shape with a clear systolic peak, a gradual dicrotic notch on the descending slope, and consistent amplitude from beat to beat. Abnormal readings show irregular timing, flattened peaks, noisy baselines, or distorted morphology. Understanding what each feature means allows clinicians, researchers, and informed users to extract far more from a PPG trace than just heart rate.
What a PPG Signal Actually Represents
Photoplethysmography works by shining light into tissue and measuring how much is absorbed or reflected. Because blood absorbs light differently than surrounding tissue, each pulse of blood that arrives during systole changes the optical signal. The result is a rhythmic waveform that tracks the cardiac cycle in real time.
Every point on that waveform carries physiological meaning. The rising edge reflects how fast blood is being ejected from the heart. The peak marks maximum arterial distension. The falling edge shows the relaxation phase. Even the small ripple partway down the descending slope tells you something about vascular tone and aortic valve closure.
For a deeper grounding in the anatomy of this signal, see PPG Waveform: Anatomy, Features, and Clinical Meaning.
The Normal PPG Waveform
Shape and Timing
A textbook normal PPG pulse has four identifiable regions:
-
The anacrotic (ascending) limb. This is the sharp upstroke that begins at the onset of systole. In healthy adults it is steep and takes roughly 100 to 150 ms to reach peak amplitude. A slow or delayed upstroke can indicate reduced cardiac output or upstream obstruction.
-
The systolic peak. The highest point of the waveform. Amplitude here reflects stroke volume and vascular compliance. On wrist-based monitors the peak is somewhat rounded; on finger-based sensors it tends to be sharper.
-
The dicrotic notch. A small deflection on the descending slope, typically occurring about two thirds of the way down from the systolic peak. This corresponds to aortic valve closure. Its position shifts with vascular tone, making it a useful marker for arterial stiffness assessments. More on this below.
-
The diastolic peak. A second, smaller shoulder or hump following the dicrotic notch. It represents the reflected pressure wave returning from the periphery. In young healthy subjects this peak is visible and well separated from the systolic peak. In older adults or those with stiffened arteries, the reflected wave arrives earlier and merges into the systolic peak, raising it and obscuring the diastolic hump.
Amplitude Consistency
Beat-to-beat amplitude should be relatively uniform during quiet rest. Small variations of up to about 10 percent are normal due to respiratory modulation of venous return. Larger amplitude swings, particularly those that track breathing, are a sign of pulsus paradoxus or significant hypovolemia.
Rate and Regularity
At rest, most healthy adults have a heart rate between 50 and 100 beats per minute. The intervals between successive systolic peaks (RR intervals in ECG terms, PP intervals in PPG terms) should vary slightly due to physiological heart rate variability. Completely rigid, metronomic timing with no variation at all can actually indicate autonomic dysfunction rather than perfect health.
AC and DC Components
Every PPG signal contains two superimposed signals that carry different information.
The DC component is the slow-moving baseline. It reflects the average light absorption of tissue, including venous blood, arterial blood at rest, and non-vascular structures. The DC level shifts gradually with changes in ambient light, sensor contact pressure, skin temperature, and venous pooling. It does not carry beat-to-beat pulsatile information but it sets the operating point for the sensor.
The AC component is the pulsatile oscillation riding on top of the DC baseline. It is produced entirely by arterial blood volume changes during each cardiac cycle. The ratio of AC amplitude to DC level is called the perfusion index (PI), and it is one of the most clinically useful single numbers derivable from a PPG reading.
A high AC-to-DC ratio means strong pulsatile flow relative to background absorption. This typically reflects good peripheral perfusion and strong cardiac output. A very low ratio, sometimes below 0.2 percent, suggests vasoconstriction, hypotension, hypothermia, or poor sensor contact.
The AC/DC ratio is also the basis for pulse oximetry. SpO2 calculations compare the ratio at two wavelengths (red and infrared) to infer hemoglobin oxygen saturation. Signal quality falls when the AC component becomes too small relative to noise in the DC baseline. For a full technical treatment of this ratio, see PPG AC/DC Ratio Explained.
The Dicrotic Notch: What It Tells You
The dicrotic notch is one of the most physiologically informative features in the PPG waveform. It marks the moment the aortic valve closes at the end of systolic ejection. In a compliant, healthy arterial system the notch sits at roughly 60 to 70 percent of the pulse period and is clearly visible as a distinct deflection.
When arterial stiffness increases, the notch migrates upward toward the systolic peak. In very stiff arteries it can disappear entirely, merging into a flat or slightly inflected descending slope. This shift happens because a stiffer vessel transmits the reflected pressure wave faster, so it arrives back at the measurement site before aortic valve closure has fully separated it from the initial ejection wave.
Clinically, a high notch position (expressed as the ratio of notch time to pulse period) correlates with elevated pulse wave velocity, increased augmentation index, and higher cardiovascular risk in population studies. Conversely, vasodilator drugs, exercise-induced peripheral dilation, or fever tend to lower the notch and exaggerate the diastolic peak.
The physiology behind this feature is covered in detail at PPG Dicrotic Notch Physiology, and quantitative extraction methods are described in PPG Morphology Features.
Abnormal PPG Patterns
Irregular Rhythm
Beat-to-beat interval variability that exceeds normal respiratory sinus arrhythmia is a red flag. In atrial fibrillation, PP intervals are chaotically irregular with no repeating pattern. The amplitude also varies because ventricular filling time changes from beat to beat. Ectopic beats appear as single premature pulses followed by a compensatory pause and a stronger beat (the postextrasystolic potentiation).
A PPG-based irregular rhythm detection algorithm is more sensitive when it examines multiple consecutive intervals rather than just adjacent pairs. Single-lead assessments are prone to false positives from motion artifacts that mimic irregular timing.
Low Perfusion
When peripheral circulation is compromised, the AC component shrinks while the DC component may stay normal or decrease. The waveform looks dampened. Peak-to-trough amplitude drops. The upstroke slows. In severe cases you may lose the dicrotic notch entirely because the pulse is too weak to produce a visible reflected wave feature.
Causes include: vasoconstriction from cold, sympathetic activation, septic shock (late), significant blood loss, and high-dose vasopressor therapy. Bilateral comparison is useful. A unilateral drop in PPG amplitude suggests regional arterial obstruction rather than systemic low output.
Motion Artifacts
Motion artifact is the most common source of errors in wearable and ambulatory PPG monitoring. Physical movement injects large, irregular fluctuations into both the AC and DC components. The resulting trace looks jagged or contains spurious peaks that do not correspond to cardiac cycles.
Classic artifact signatures include: sharp transient spikes from impact (stepping, typing), slow drifting baseline from postural shifts, and rhythmic interference at movement frequencies that happen to overlap with resting heart rate (roughly 1 to 2 Hz). This last scenario is particularly problematic for wrist-worn devices during walking or running.
Signal processing approaches to artifact removal include adaptive filtering, spectral subtraction using accelerometer data, and independent component analysis. From a practical interpretation standpoint, any stretch of recording where the waveform loses its regular morphology should be treated as unreliable until the signal stabilizes.
Waveform Morphology Changes
Beyond rhythm and amplitude, shape changes carry clinical meaning:
- Peaked, narrow pulses with a high augmentation index suggest arterial stiffness.
- Rounded, broad pulses with a large anachrotic shoulder can indicate aortic stenosis reducing the ejection rate.
- Bisferiens pulses (double-peaked systolic phase without a clear dicrotic notch) occur in hypertrophic cardiomyopathy or significant aortic regurgitation.
- Respiratory amplitude variation greater than 15 to 20 percent across a breathing cycle indicates significant preload sensitivity and is used as a guide for fluid responsiveness in ventilated ICU patients.
Assessing PPG Signal Quality
Signal quality assessment is not optional. A high-confidence interpretation requires knowing whether the waveform is reliable before drawing clinical conclusions. This applies whether you are reading a monitor at the bedside or reviewing data exported from a consumer smartwatch.
Visual Inspection
Start with the raw trace. Look for:
- Consistent pulse morphology from beat to beat
- A stable DC baseline with only slow respiratory drift
- Clear systolic peaks that are easily distinguishable from noise
- Absence of sudden transient spikes or flat-line segments
A waveform that passes this visual check is usually reliable for heart rate calculation. Morphological analysis (notch position, augmentation index, pulse transit time) requires higher signal quality and a more rigorous evaluation.
Quantitative Quality Metrics
Several metrics are used in research and clinical device firmware to score signal quality automatically:
Signal-to-noise ratio (SNR). Calculated in the frequency domain by comparing power at the fundamental heart rate frequency and its harmonics to total out-of-band power. SNR values above 10 dB generally indicate acceptable quality. Below 5 dB the signal is dominated by noise.
Template correlation. Each individual pulse is compared against a running template (the average of recent clean pulses). A correlation coefficient above 0.9 indicates the pulse matches the template well. Sudden drops flag artifacts or ectopic beats.
Perfusion index threshold. Most commercial pulse oximeters display a quality indicator that is partly driven by PI. A PI below 0.5 percent puts the reading in a caution zone. Below 0.2 percent, most devices will display an error or low confidence flag.
Spectral entropy. A high-entropy spectrum indicates energy spread across many frequencies rather than concentrated at heart rate harmonics, which is characteristic of noise-dominated recordings.
For a complete technical review of quality scoring algorithms and their clinical thresholds, see PPG Signal Quality Assessment.
Practical Tips for Improving Signal Quality at the Bedside or at Home
- Ensure the sensor is positioned correctly and securely. On a finger, the probe should be placed on the fingertip pad. Loosely clipped sensors introduce motion artifact even during quiet rest.
- Warm the extremity before measurement if the patient is cold or vasoconstricted. Brief warming (a warm towel or 10 minutes in a warm room) can increase PI by several fold.
- Ask the patient to rest quietly for at least 30 seconds before relying on morphological features. Heart rate and SpO2 stabilize faster than waveform shape.
- On wrist-worn devices, a tighter, consistent fit significantly reduces motion artifact. The sensor should sit about one finger-width above the wrist bone.
- Avoid pressing directly on the sensor. Excessive contact pressure collapses capillaries, eliminating pulsatile flow and flattening the AC component.
Reading PPG Data on Monitors and Apps
Clinical bedside monitors display a continuous PPG trace alongside numerics for SpO2, heart rate, and a waveform quality indicator. Most ICU monitors let you scale the trace amplitude, but scaling only changes the display gain. A scaled-up trace can make a weak signal look normal, so always check the perfusion index rather than judging amplitude by eye.
Consumer health apps increasingly expose summary waveform data. The key limitation is that consumer devices rarely display the actual waveform, so users cannot assess quality visually. Rely on the app's confidence score if available. If a measurement was taken during movement or cold conditions, treat it as provisional.
Key References
Allen, J. (2007) provides a comprehensive review of photoplethysmography in clinical monitoring, covering waveform interpretation, signal quality, and clinical applications. (doi: 10.1088/0967-3334/28/3/R01)
Elgendi, M. et al. (2013) examined methods for PPG signal analysis and defined quantitative criteria for peak detection and morphology extraction. (doi: 10.1371/journal.pone.0076585)
Frequently Asked Questions
What does a normal PPG reading look like?
A normal PPG shows a smooth, repeating waveform with a sharp upstroke, a single dominant systolic peak, a small dicrotic notch on the descending slope, and a secondary diastolic shoulder. Beat-to-beat amplitude should be consistent, and the baseline should be stable with only slow respiratory drift. The rate should be between 50 and 100 beats per minute at rest, with mild variability from breath to breath.
What is the dicrotic notch and why does it matter?
The dicrotic notch is a small dip on the falling edge of each PPG pulse. It marks aortic valve closure at the end of systole. Its position along the descending slope reflects arterial stiffness. In young, compliant arteries it sits low on the slope. As arteries stiffen with age or disease, the notch migrates upward. Clinicians and researchers use notch position as a non-invasive marker of vascular age and cardiovascular risk.
How do I know if my PPG signal quality is good enough to trust?
Look for consistent pulse shapes from beat to beat, a stable baseline, and clear identifiable peaks. Quantitatively, a perfusion index above 0.5 percent and a signal-to-noise ratio above 10 dB in the frequency domain are commonly used thresholds. On consumer devices, use any displayed quality or confidence indicator. If a reading was taken during movement or in cold conditions, repeat it during quiet rest before acting on the result.
What causes a weak or flattened PPG waveform?
Low perfusion index and flattened AC components usually indicate poor peripheral circulation at the measurement site. Common causes include vasoconstriction (cold exposure, anxiety, high-dose vasopressors), hypovolemia, hypotension, or poor sensor contact. In clinical settings, bilateral comparison helps distinguish local arterial occlusion from systemic low output. Warming the limb and securing the sensor usually improves signal quality when the underlying physiology is reversible.
Can PPG detect an irregular heartbeat?
Yes, with caveats. Beat-to-beat interval analysis from a clean PPG trace can detect atrial fibrillation with high sensitivity. The challenge is distinguishing true rhythm irregularity from motion artifact. Clinical-grade detection requires at least 30 to 60 seconds of clean signal. Consumer devices with FDA clearance for AFib detection have undergone prospective validation; those without clearance should be used for screening only.
What is the difference between the AC and DC components in a PPG signal?
The AC component is the pulsatile part of the PPG, generated by arterial blood volume changes with each heartbeat. The DC component is the non-pulsatile background, reflecting constant absorption from venous blood, tissue, and ambient light. The AC-to-DC ratio (perfusion index) indicates how strong the arterial pulse is relative to background signal. This ratio is the basis for pulse oximetry and is used as a primary signal quality metric in most devices.
Why does my PPG reading look different on my wrist versus a finger clip?
Wrist sensors measure further from the arterial tree and through more tissue layers. Wrist-based waveforms tend to be smoother and more rounded, with a subdued dicrotic notch and lower perfusion index. Fingertip readings have higher amplitude and sharper morphology. Neither site is inherently better, but they have different characteristics that affect feature extraction and interpretation.