PPG AC DC Ratio Explained
The ratio of the AC (pulsatile) to DC (non-pulsatile) components of the photoplethysmographic signal is the fundamental measurement upon which pulse o...
The ratio of the AC (pulsatile) to DC (non-pulsatile) components of the photoplethysmographic signal is the fundamental measurement upon which pulse oximetry is built. Every SpO2 reading displayed on every pulse oximeter in the world, from fingertip consumer devices to ICU-grade monitors, derives from this ratio computed at two wavelengths. Understanding the AC/DC ratio is essential for anyone working with PPG signals, whether designing pulse oximeters, developing SpO2 estimation algorithms, or interpreting clinical measurements.
This article explains the physics, mathematics, and practical engineering behind the AC/DC ratio in pulse oximetry, including the calibration process, sources of error, and limitations that every PPG researcher and engineer should understand. For a broader introduction to PPG technology, see our comprehensive PPG guide.
Anatomy of the PPG Signal: AC and DC Components
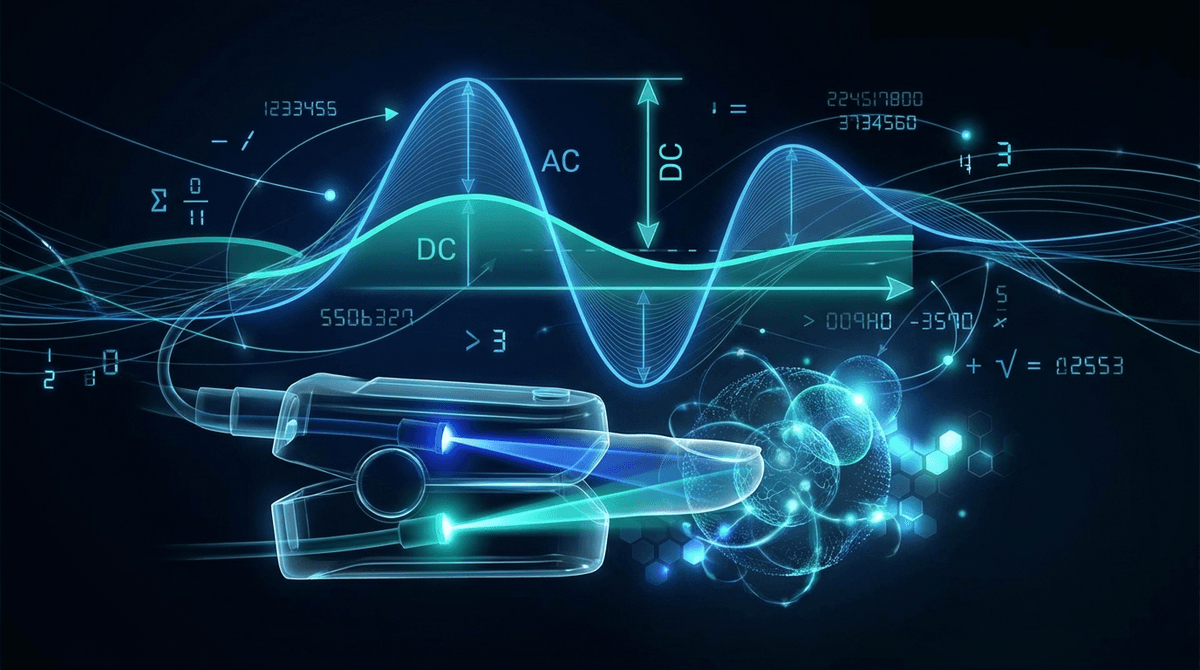
A photoplethysmographic signal recorded from living tissue consists of two superimposed components that reflect fundamentally different physiological processes.
The DC Component
The DC component is the large, relatively constant baseline of the PPG signal. It represents the total light absorption (or, equivalently, the total attenuation of detected light) by all non-pulsatile elements in the optical path:
- Skin tissue and epidermis: Melanin, keratin, and dermal collagen absorb and scatter light independently of cardiac activity. The contribution of melanin varies significantly with skin pigmentation and is wavelength-dependent, with higher absorption at shorter wavelengths.
- Bone and connective tissue: In transmission-mode measurements (fingertip clip), bone within the optical path contributes a fixed attenuation.
- Venous blood: Venous blood volume changes slowly with respiration and posture but not with each heartbeat, so it contributes to the DC component. Venous blood is less oxygenated than arterial blood, which affects the wavelength-dependent DC level.
- Non-pulsatile arterial blood: Even in arteries, there is a baseline blood volume present throughout the cardiac cycle. Only the incremental volume change during systole contributes to the AC component.
The DC component typically accounts for 95-99% of the total PPG signal. Its magnitude depends on tissue composition, sensor geometry, LED intensity, and photodetector gain. While the DC component is often treated as a nuisance to be normalized away, it carries useful information: its absolute value reflects overall tissue optical properties, and slow variations in DC can indicate venous congestion, sensor displacement, or respiratory-induced blood volume changes.
The AC Component
The AC component is the small pulsatile fluctuation superimposed on the DC baseline. It represents the change in light absorption caused by the cardiac-driven increase in arterial blood volume during systole:
- During systole, a bolus of arterial blood enters the microvasculature, increasing the local blood volume and therefore the light absorption.
- During diastole, blood volume decreases as the pulse wave passes, reducing absorption.
- The resulting oscillation in detected light intensity is the AC component, and its waveform mirrors the arterial blood volume pulse.
The AC component is typically 0.5-5% of the total signal, making it a small signal riding on a large baseline. The exact AC amplitude depends on arterial pulse pressure, local vascular compliance, measurement site, and sensor configuration. The ratio of AC to DC is the Perfusion Index (PI), discussed in our dedicated article.
Critically, the AC component represents light absorption changes caused exclusively by arterial blood, because only arterial blood volume changes with each heartbeat. This arterial specificity is the key insight that makes pulse oximetry possible: by analyzing the pulsatile component, the pulse oximeter isolates the optical properties of arterial blood from the confounding absorption of surrounding tissue.
The Beer-Lambert Law and PPG
The theoretical foundation connecting the AC/DC ratio to blood oxygen saturation is the Beer-Lambert law, which describes how light is attenuated as it passes through an absorbing medium.
Classical Beer-Lambert Law
For monochromatic light passing through a homogeneous absorbing solution:
I = I_0 * e^(-epsilon * c * d)
Where I is the transmitted light intensity, I_0 is the incident intensity, epsilon is the molar absorption coefficient (wavelength-dependent), c is the concentration of the absorber, and d is the path length through the medium.
The absorbance A is defined as:
A = -ln(I / I_0) = epsilon * c * d
For a medium containing multiple absorbers (such as oxyhemoglobin and deoxyhemoglobin), the total absorbance is the sum of individual contributions:
A = epsilon_HbO2 * c_HbO2 * d + epsilon_Hb * c_Hb * d
Application to Pulse Oximetry
In the pulse oximetry model, the tissue is conceptualized as a layered medium. The total absorbance at any wavelength has a constant component (from tissue, venous blood, and baseline arterial blood) and a variable component (from the pulsatile arterial blood volume change):
A_total = A_constant + A_pulsatile
The change in absorbance during a cardiac cycle (delta-A) corresponds to the pulsatile arterial blood:
delta-A = epsilon_a * c_a * delta-d
Where epsilon_a is the composite absorption coefficient of arterial blood at the measurement wavelength, c_a is the concentration (effectively the hematocrit), and delta-d is the change in arterial blood path length (proportional to blood volume change).
The AC/DC ratio at a given wavelength approximates this pulsatile absorbance change:
AC/DC approximately equals delta-A = (epsilon_HbO2 * SaO2 + epsilon_Hb * (1 - SaO2)) * c_total * delta-d
Where SaO2 is the fractional arterial oxygen saturation (the quantity we want to measure).
The Ratio-of-Ratios: From AC/DC to SpO2
The central mathematical operation of pulse oximetry is computing the ratio of the AC/DC values at two wavelengths:
R = (AC_red / DC_red) / (AC_IR / DC_IR)
This ratio R eliminates several unknown variables. The arterial path length change delta-d cancels because it is the same at both wavelengths (both LEDs measure the same pulse). The total hemoglobin concentration cancels because it appears identically in both numerator and denominator. What remains is a value that depends primarily on the relative absorption coefficients of HbO2 and Hb at the two wavelengths, which in turn depends only on SpO2.
The Theoretical R-SpO2 Relationship
From the Beer-Lambert model, the theoretical relationship is:
SpO2 = (epsilon_Hb_R - R * epsilon_Hb_IR) / ((epsilon_Hb_R - epsilon_HbO2_R) - R * (epsilon_Hb_IR - epsilon_HbO2_IR))
Where subscripts R and IR denote red (660nm) and infrared (940nm) wavelengths, respectively. Using published molar extinction coefficients (Prahl, 1999, Oregon Medical Laser Center):
- epsilon_HbO2 at 660nm approximately 320 L/(mol*cm)
- epsilon_Hb at 660nm approximately 3,500 L/(mol*cm)
- epsilon_HbO2 at 940nm approximately 1,050 L/(mol*cm)
- epsilon_Hb at 940nm approximately 700 L/(mol*cm)
Substituting these values yields the theoretical calibration curve. At R = 0.4, SpO2 is approximately 100%. At R = 1.0, SpO2 is approximately 85%. At R = 3.4, SpO2 is approximately 0%. The relationship is approximately linear in the clinical range (SpO2 70-100%), which is why many texts present the simplified approximation:
SpO2 approximately equals 110 - 25 * R
This linear approximation works reasonably well for SpO2 above 80% but diverges significantly at lower saturations. For a deeper exploration of SpO2 algorithm implementation, see our SpO2 estimation algorithms page.
Empirical Calibration: Why Theory Is Not Enough
The Beer-Lambert model, while providing the theoretical framework, fails to accurately predict SpO2 from R in practice. The discrepancy arises from several factors that violate Beer-Lambert assumptions.
Light Scattering
The Beer-Lambert law assumes a purely absorbing, non-scattering medium. Biological tissue is a highly scattering medium: photons undergo multiple scattering events as they travel through skin, muscle, and blood. Scattering increases the effective optical path length beyond the geometric distance, and the degree of scattering is wavelength-dependent (shorter wavelengths scatter more). This distorts the AC/DC ratio in ways that the simple Beer-Lambert model does not predict.
Schmitt (1991) published a comprehensive analysis of the effects of scattering on pulse oximetry and demonstrated that the theoretical R-SpO2 curve deviates from the empirical curve by 5-10% SpO2 at saturations below 80% (DOI: 10.1007/BF02368327). The scattering contribution is particularly significant in reflectance-mode PPG, where photons may travel complex, highly scattered paths between the LED and photodetector.
LED Spectral Bandwidth
The Beer-Lambert law assumes monochromatic light. Real LEDs have a spectral bandwidth of 20-50nm (full width at half maximum). Because hemoglobin absorption coefficients change rapidly with wavelength, especially in the red region near 660nm, the finite bandwidth introduces a systematic bias. LEDs from different manufacturing batches may have slightly different center wavelengths and spectral shapes, requiring batch-specific or individual-device calibration.
Empirical Calibration Process
Because of these theoretical limitations, all clinical pulse oximeters are calibrated using empirical data from controlled human desaturation studies. In these studies, healthy volunteers breathe hypoxic gas mixtures while their SpO2 is simultaneously measured by the pulse oximeter (providing R) and by arterial blood gas analysis (providing true SaO2). The resulting paired (R, SaO2) data points are fitted with a polynomial or look-up table that maps R directly to SpO2, bypassing the Beer-Lambert prediction entirely.
The FDA requires pulse oximeter manufacturers to perform these calibration studies with a minimum of 200 paired data points from at least 10 subjects across SpO2 levels from 70% to 100%, with representation across skin pigmentation levels (as specified in FDA guidance document for pulse oximeters, 2013, updated 2022). The resulting calibration curve, stored in the device firmware, is the critical intellectual property of each pulse oximeter manufacturer and accounts for their specific LED wavelengths, spectral profiles, optical geometry, and signal processing. For more information on how these calibration differences affect real-world readings, see our pulse oximeter readings chart.
Factors Affecting the AC/DC Ratio
Motion Artifact
Motion artifact is the primary real-world challenge to accurate AC/DC ratio measurement. Any non-cardiac fluctuation in the PPG signal introduces error into the AC component. Because R requires accurate AC measurement at both wavelengths, even small motion artifacts can cause significant SpO2 errors. A motion-induced increase in the red AC component relative to infrared, for example, will increase R and falsely decrease the displayed SpO2.
Modern pulse oximeters employ various strategies to mitigate motion artifact effects on the R calculation: time-domain artifact detection (rejecting pulses with abnormal morphology), frequency-domain analysis (isolating the cardiac frequency component), and multi-sensor averaging. For a detailed review of these techniques, see our motion artifact removal guide.
Dyshemoglobins
Conventional two-wavelength pulse oximeters assume that arterial blood contains only two hemoglobin species: HbO2 and Hb. In reality, carboxyhemoglobin (COHb, from carbon monoxide exposure) and methemoglobin (MetHb, from oxidant stress or certain medications) may also be present.
COHb absorbs red light similarly to HbO2, causing standard pulse oximeters to overestimate SpO2 in carbon monoxide poisoning patients. A patient with 30% COHb and 70% HbO2 may display SpO2 readings of 95-99%, masking a critically dangerous condition. MetHb absorbs equally at red and infrared wavelengths, driving R toward 1.0 and SpO2 toward approximately 85% regardless of actual oxygen saturation.
Advanced co-oximeters (such as Masimo rainbow SET) use 7-12 wavelengths to resolve additional hemoglobin species, effectively extending the two-wavelength AC/DC ratio approach to a multi-wavelength system of equations. Barker et al. (2006) validated that multi-wavelength pulse oximetry could simultaneously measure SpO2, COHb, and MetHb with clinically useful accuracy (DOI: 10.1097/00000542-200608000-00009).
Skin Pigmentation
Melanin absorption affects the DC component at both wavelengths but not proportionally. Because melanin absorbs more red light than infrared, the DC_red/DC_IR ratio differs between lightly and darkly pigmented skin. While the AC/DC ratio calculation partially compensates for melanin (since melanin affects both AC and DC similarly at each wavelength), the compensation is imperfect.
Sjoding et al. (2020) published a landmark study in the New England Journal of Medicine demonstrating that pulse oximeters overestimated SpO2 by 3.56 percentage points in Black patients compared to White patients at the same true arterial saturation, with clinically significant rates of occult hypoxemia (SpO2 displayed 92-96% when SaO2 was actually below 88%) occurring nearly three times more frequently in Black patients (DOI: 10.1056/NEJMc2029240). This bias is a direct consequence of the AC/DC ratio being affected by melanin absorption in ways not fully captured by empirical calibration curves derived from predominantly light-skinned study populations.
Venous Pulsation
The fundamental assumption of pulse oximetry is that only arterial blood pulsates. However, venous blood can exhibit pulsation in several clinical scenarios: right heart failure (causing venous congestion with transmitted cardiac pulsations), tricuspid regurgitation, positive-pressure mechanical ventilation, and tight sensor application causing venous congestion. When venous blood pulsates, the AC component contains contributions from both arterial and venous blood, and because venous blood has lower oxygen saturation than arterial blood, venous pulsation biases SpO2 readings downward. Understanding this distinction between arterial and venous contributions is fundamental to PPG signal interpretation, which we discuss further in our learning resources.
Low Perfusion
When peripheral perfusion is poor (low Perfusion Index), the AC component becomes very small relative to the noise floor. The signal-to-noise ratio of the AC/DC measurement degrades, causing increased variability and potential bias in R calculation. Most pulse oximeters display a low-perfusion indicator and may withhold SpO2 readings when PI drops below a device-specific threshold, typically 0.2-0.5.
DC Component Analysis: Beyond Simple Normalization
While the DC component is often treated merely as a normalization factor, it contains physiologically meaningful information that is increasingly being exploited in research.
Respiratory Rate from DC Variations
Breathing causes cyclical changes in intrathoracic pressure that modulate venous return and peripheral blood volume. These respiratory-induced fluctuations appear as slow oscillations (0.15-0.5 Hz) in the DC component of the PPG signal. By extracting these oscillations through bandpass filtering or frequency analysis, respiratory rate can be estimated non-invasively from the same PPG signal used for SpO2 and heart rate.
Nilsson et al. (2005) demonstrated that respiratory rate extracted from the PPG DC component showed mean absolute errors of 1.2 breaths per minute compared to reference respiratory monitoring in 30 surgical patients, making it clinically useful for continuous respiratory surveillance.
Venous Oxygen Saturation Estimation
Research groups have explored using the DC component at multiple wavelengths to estimate mixed venous oxygen saturation (SvO2), since the DC signal includes a venous blood contribution. Walton et al. (2010) proposed a method to separate arterial and venous contributions by analyzing both AC and DC components across multiple wavelengths, estimating venous saturation alongside arterial saturation. The approach remains experimental, with accuracy limited by the difficulty of isolating the venous contribution from other DC sources (tissue, skin, bone).
Engineering Implementation
Analog Signal Conditioning
Extracting the AC and DC components from the raw photodetector signal requires careful analog circuit design. The photodetector current is first converted to a voltage by a transimpedance amplifier. The DC component is then separated using a low-pass filter (cutoff typically 0.1-0.5 Hz), and the AC component is obtained by either high-pass filtering (cutoff 0.3-0.5 Hz) or by subtracting the DC estimate from the total signal.
The dynamic range challenge is significant: the AC component is 20-40 dB below the DC level, so accurately measuring both requires either a high-resolution analog-to-digital converter (typically 18-24 bits) or a two-stage measurement approach where the DC baseline is removed in analog before amplifying and digitizing the AC component with a lower-resolution ADC. Modern pulse oximeter ASICs (such as the Maxim MAX86150 or Texas Instruments AFE4404) integrate this signal conditioning on-chip with 19-22 bit effective resolution.
Digital AC/DC Ratio Computation
In digital implementations, the AC component amplitude is typically computed as the peak-to-trough difference within each cardiac cycle, identified by peak detection algorithms. The DC value is taken as the moving average of the signal over several cardiac cycles. The ratio AC/DC is then computed for each beat and averaged over a window (typically 4-8 seconds) to produce the final R value for SpO2 lookup.
Timing synchronization between red and infrared measurements is critical because the two LEDs are multiplexed (alternately pulsed) rather than illuminated simultaneously. Typical LED multiplexing rates are 500-2000 Hz, with each LED-on period lasting 50-200 microseconds. The short LED-on times also reduce ambient light interference and power consumption. Any timing mismatch between the red and infrared AC measurements introduces error in R, so careful digital synchronization is required. For detailed information about PPG signal processing pipelines, see our algorithms overview.
Summary
The AC/DC ratio is the atomic measurement of pulse oximetry and one of the most important derived quantities in photoplethysmography. By computing this ratio at red and infrared wavelengths and taking their ratio-of-ratios (R), pulse oximeters determine arterial oxygen saturation non-invasively. While the Beer-Lambert law provides the theoretical framework, empirical calibration from human desaturation studies is required for clinical accuracy due to tissue scattering, LED bandwidth, and biological variability. Understanding the sources of error in AC/DC ratio measurement, from motion artifact and dyshemoglobins to skin pigmentation bias, is essential for anyone developing or deploying PPG-based SpO2 systems.
Frequently Asked Questions
What do the AC and DC components of a PPG signal represent?
The AC component represents the pulsatile portion of the PPG signal caused by arterial blood volume changes with each heartbeat. It typically constitutes only 1-5% of the total signal. The DC component represents the non-pulsatile baseline, reflecting constant absorption by skin, bone, venous blood, and non-pulsatile arterial blood. The AC component carries cardiac timing information and is used for heart rate measurement, while the ratio of AC to DC across two wavelengths forms the basis of SpO2 calculation.
Why does pulse oximetry require two wavelengths?
Pulse oximetry requires two wavelengths because SpO2 determination depends on comparing how oxygenated and deoxygenated hemoglobin absorb light differently. At 660nm (red), deoxyhemoglobin absorbs roughly 10 times more light than oxyhemoglobin. At 940nm (infrared), oxyhemoglobin absorbs approximately 2-3 times more than deoxyhemoglobin. By computing the ratio of AC/DC at each wavelength (the ratio-of-ratios R), the pulse oximeter obtains a value that depends primarily on the relative concentrations of the two hemoglobin species, allowing SpO2 calculation.
How accurate is the Beer-Lambert model for pulse oximetry?
The Beer-Lambert law provides the theoretical framework for pulse oximetry but is an oversimplification of real light-tissue interaction. It assumes purely absorbing media without scattering, monochromatic light, and homogeneous distribution. In biological tissue, significant light scattering occurs, LEDs have finite spectral bandwidth, and tissue is highly heterogeneous. Because of these deviations, pulse oximeters rely on empirical calibration curves derived from controlled human desaturation studies rather than purely theoretical Beer-Lambert predictions. The theoretical R-to-SpO2 relationship deviates from empirical calibration by 5-10% SpO2 at low saturation values.
What causes pulse oximeter inaccuracy at low SpO2 levels?
Several factors reduce accuracy below approximately 80% SpO2. Empirical calibration data becomes sparse because human desaturation studies cannot ethically reduce saturation below 70-75%. The relationship between R and SpO2 becomes increasingly nonlinear at low saturations. Tissue scattering effects become more pronounced as the hemoglobin absorption spectrum changes with deep desaturation. Additionally, dyshemoglobins (carboxyhemoglobin, methemoglobin) become proportionally more influential at low functional saturation levels. Most pulse oximeters are specified as accurate within 2-3% for SpO2 values of 70-100% and are unreliable below 70%.
References
- Schmitt (1991) published a comprehensive analysis of the effects of scattering on pulse oximetry and demonstrated that the theoretical R-SpO2 curve deviates from the empirical curve by 5-10% SpO2 at saturations below 80% (DOI: 10.1007/BF02368327). The scattering contribution is particularly significant in reflectance-mode PPG, where photons may travel complex, highly scattered paths between the LED and photodetector.
- Advanced co-oximeters (such as Masimo rainbow SET) use 7-12 wavelengths to resolve additional hemoglobin species, effectively extending the two-wavelength AC/DC ratio approach to a multi-wavelength system of equations. Barker et al. (2006) validated that multi-wavelength pulse oximetry could simultaneously measure SpO2, COHb, and MetHb with clinically useful accuracy (DOI: 10.1097/00000542-200608000-00009).
- Sjoding et al. (2020) published a landmark study in the New England Journal of Medicine demonstrating that pulse oximeters overestimated SpO2 by 3.56 percentage points in Black patients compared to White patients at the same true arterial saturation, with clinically significant rates of occult hypoxemia (SpO2 displayed 92-96% when SaO2 was actually below 88%) occurring nearly three times more frequently in Black patients (DOI: 10.1056/NEJMc2029240). This bias is a direct consequence of the AC/DC ratio being affected by melanin absorption in ways not fully captured by empirical calibration curves derived from predominantly light-skinned study populations.