PPG Signal: What It Is, How It's Measured, and What It Tells You
A PPG signal is an optical recording of blood volume changes in tissue with every heartbeat. This guide explains PPG signal components, quality factors, and what the signal encodes.
A PPG signal is a continuous optical recording of blood volume changes in living tissue, captured by shining light into the skin and measuring how much returns. Each pulse of blood arriving with a heartbeat absorbs slightly more light; the gaps between beats absorb less. This rhythmic variation in light absorption — plotted over time — is the PPG signal.
It is the underlying data stream that powers heart rate tracking in every modern smartwatch, SpO₂ monitoring in clinical pulse oximeters, and a growing list of cardiovascular health metrics extracted from wearables. Understanding the structure of the PPG signal is the first step toward understanding what it can and cannot tell you about health.
The Structure of a PPG Signal
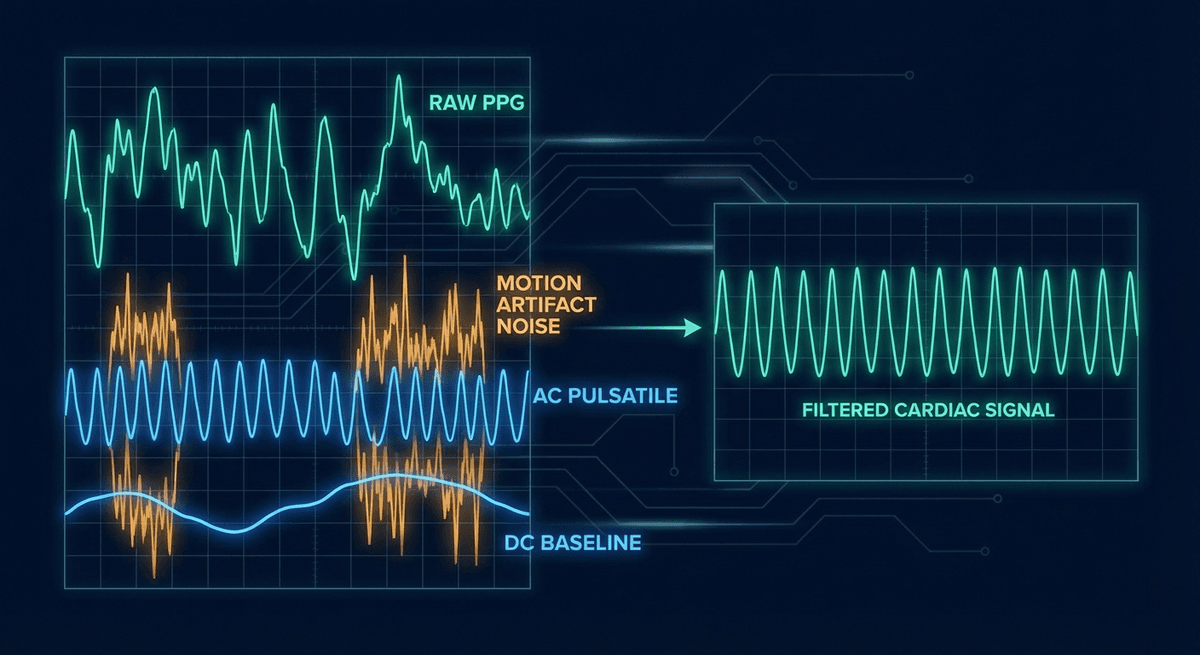
A raw PPG signal is not a single clean sine wave — it is a composite of several overlapping components:
AC Component (Pulsatile)
The AC component is the rhythmic, cardiac-synchronous variation. It rises and falls with each heartbeat at a rate of roughly 60–100 times per minute at rest. This is the clinically useful part — it encodes:
- Heart rate (the frequency of the oscillation)
- Pulse waveform shape (morphology tied to arterial compliance, vascular tone)
- Beat-to-beat interval variability (heart rate variability, or HRV)
- Respiratory modulation (the amplitude of peaks varies with breathing)
The AC component is typically small in absolute terms. At the wrist with a green LED, it represents only about 1–5% of total detected light. Getting a clean AC signal out of a noisy raw measurement is the central challenge in wearable PPG design.
DC Component (Non-Pulsatile)
The DC component is the large, slow-varying baseline on which the AC rides. It represents everything that absorbs light but does not pulse with the heartbeat: venous blood, tissue (fat, muscle, connective tissue), skin pigmentation, and the ambient light environment.
The DC level shifts gradually with changes in posture, temperature, and longer-timescale physiological changes. Most algorithms remove the DC component early in processing (via high-pass filtering or detrending) before analyzing the AC component.
Noise Components
Real-world PPG signals contain additional unwanted components:
Motion artifact: When the sensor moves relative to the skin, the physical pressure changes and the optical path changes. This generates noise at the same frequencies as the cardiac signal — particularly during walking (around 1–2 Hz) or running (around 2–3 Hz). Motion artifact is the dominant source of error in wrist-based heart rate monitoring during exercise.
Ambient light: Fluorescent lights flicker at 50/60 Hz (line frequency), and sunlight changes with movement. Poorly shielded sensors pick this up as noise. Most sensors use ambient light cancellation techniques — pulsing the LED and subtracting the "LED off" measurement.
Baseline drift: Slow changes in the DC baseline that can bleed into the AC band if not properly filtered. Often caused by posture changes, changes in skin contact pressure, or temperature shifts.
Quantization noise: Digital sampling introduces quantization error. Adequate ADC bit depth (typically 16–24 bits for medical-grade devices, 12–16 bits for consumer devices) keeps this below the noise floor of physiological signals.
How a PPG Signal Is Captured
Hardware Elements
LED: The light source. Common choices:
- Green (520–550 nm): Strongly absorbed by both oxy- and deoxyhemoglobin. High contrast, strong AC component. Preferred for heart rate at the wrist. More affected by skin melanin than longer wavelengths.
- Red (620–700 nm): Used in pulse oximetry (660 nm standard). Moderately absorbed by hemoglobin. Better tissue penetration than green. Less affected by melanin.
- Near-infrared (850–950 nm): Used in pulse oximetry (940 nm standard). Absorbed differently by oxy vs. deoxyhemoglobin — essential for SpO₂ calculation. Deep tissue penetration. Relatively unaffected by melanin.
Photodetector: Typically a photodiode with a transimpedance amplifier to convert photocurrent to voltage. Larger detector area picks up more light but also more ambient noise. Filter coatings limit detection to the LED wavelengths.
Signal conditioning: Analog front-end circuits amplify the tiny photodiode signal, apply bandpass filtering (typically 0.5–10 Hz for cardiac applications), and convert to digital. Modern dedicated AFE chips (Texas Instruments AFE4404, Maxim MAX86141) integrate all of this with very low noise floors.
Sampling Rate
For heart rate monitoring, a sampling rate of 25–50 Hz is typically sufficient — the Nyquist criterion requires at least twice the highest frequency of interest (the second harmonic of a fast heart rate at ~3 Hz requires at least 6 Hz sampling). Medical-grade equipment often samples at 125–500 Hz to preserve waveform morphology details needed for pulse wave analysis.
For HRV research, sampling rate matters significantly. At 25 Hz, beat detection timing resolution is ±40 ms — too coarse for high-frequency HRV analysis. Many dedicated HRV wearables use 128–256 Hz PPG sampling to achieve ±8 ms or better timing accuracy.
What Algorithms Extract from the PPG Signal
The raw ADC output requires several processing steps before it becomes a useful health measurement:
1. Preprocessing: Remove DC baseline, apply bandpass filter (0.5–4 Hz for resting heart rate), optionally use accelerometer data to suppress motion artifact.
2. Beat detection: Identify each pulse peak (or onset, or foot) in the filtered signal. Common algorithms: peak finding, adaptive threshold detection, derivative-based methods, template matching.
3. Feature extraction: Calculate inter-beat intervals (IBIs) from consecutive beat timestamps. Compute waveform morphology features (rise time, peak amplitude, pulse width, diastolic-to-systolic ratio, dicrotic notch position).
4. Application-specific analysis: Feed IBIs into HRV analysis, feed waveform features into blood pressure estimation, combine AC/DC ratio at two wavelengths for SpO₂, compare waveform arrival times at two sites for pulse transit time.
For a deeper look at the full pipeline, see our PPG machine learning pipeline guide.
Signal Quality Assessment
Not all PPG signals are equally useful. Signal quality indices (SQIs) flag when a signal is too corrupted for reliable analysis. Common SQI approaches include:
- Spectral SQI: Is the dominant frequency in the expected cardiac band? Is there a clean peak?
- Template matching SQI: Does each beat look like a typical PPG waveform?
- Kurtosis and skewness: Statistical descriptors that change predictably with artifact
- Perfusion index threshold: Is the AC/DC ratio above a minimum level?
Algorithms that include SQI gating — only using segments rated above a quality threshold — outperform those that process everything blindly. This is a key differentiator in clinical-grade vs. consumer-grade PPG analysis. For more on quality assessment, see our PPG signal quality assessment guide.
Applications That Depend on PPG Signal Quality
The clinical or consumer application determines the quality bar required:
| Application | Minimum Quality Requirement |
|---|---|
| Heart rate display | Moderate — 5 clean beats is enough |
| SpO₂ | High — needs steady waveforms for ratio calculation |
| HRV analysis | Very high — timing precision matters |
| Blood pressure estimation | Very high — waveform morphology must be preserved |
| AF detection | High — needs consistent IBI sequence |
| Respiratory rate | Moderate — amplitude modulation must be visible |
Frequently Asked Questions
What is a PPG signal in simple terms? It is a graph of light absorption in your tissue over time, with each heartbeat making a visible bump. When blood pulses into your finger or wrist, it absorbs slightly more light; between beats, slightly less. Plot those changes and you get the PPG signal — a wave pattern tied to your heartbeat.
What does the AC component of PPG represent? The AC (alternating current) component is the pulsatile variation in the signal that rises and falls with each heartbeat. It carries heart rate, waveform shape, HRV, and respiratory modulation. It is the clinically useful part of the PPG signal.
What causes motion artifact in PPG? Physical movement shifts the sensor relative to the skin, changing the optical path and adding noise at frequencies that overlap with the cardiac signal. The fix involves using an accelerometer alongside the PPG sensor and applying adaptive filtering to subtract the motion contribution.
How is a PPG signal different from an ECG signal? An ECG records the heart's electrical activity using skin-surface electrodes. A PPG records the mechanical consequence — blood moving through blood vessels — using light. The PPG signal is delayed by ~150–300 ms relative to the ECG R-wave. For heart rate, both work; for arrhythmia analysis, ECG is more detailed. See our PPG vs ECG comparison.
What sampling rate is needed for PPG? For heart rate monitoring, 25 Hz is adequate. For HRV analysis, at least 64–128 Hz is recommended for accurate beat timing. For detailed waveform morphology analysis, 125–250 Hz is ideal.
Can you improve PPG signal quality? Yes. Better sensor-skin contact, proper placement, reducing motion, and avoiding cold environments all improve the signal. In software, adaptive filtering, SQI gating, and machine learning denoising algorithms can recover usable signals from moderately corrupted data.
References
-
Elgendi, M. (2012). On the analysis of fingertip photoplethysmogram signals. Current Cardiology Reviews, 8(1), 14–25. https://doi.org/10.2174/157340312801215782
-
Karlen, W., Raman, S., Ansermino, J. M., & Dumont, G. A. (2013). Multiparameter respiratory rate estimation from the photoplethysmogram. IEEE Transactions on Biomedical Engineering, 60(7), 1946–1953. https://doi.org/10.1109/TBME.2013.2246160
-
Vandenberk, T., Stans, J., Mortelmans, C., et al. (2017). Clinical validation of heart rate apps: mixed-methods evaluation study. JMIR mHealth and uHealth, 5(8), e129. https://doi.org/10.2196/mhealth.7254
-
Allen, J., & Murray, A. (2003). Similarity in bilateral photoplethysmographic peripheral pulse wave characteristics at the ears, thumbs and toes. Physiological Measurement, 24(2), 329–337. https://doi.org/10.1088/0967-3334/24/2/306