Stress Recovery Monitoring with PPG: Why Recovery May Matter More Than Stress Scores
Learn how stress recovery monitoring with PPG tracks recovery after stress using heart rate, HRV, and pulse waveform signals, beyond simple stress scores.
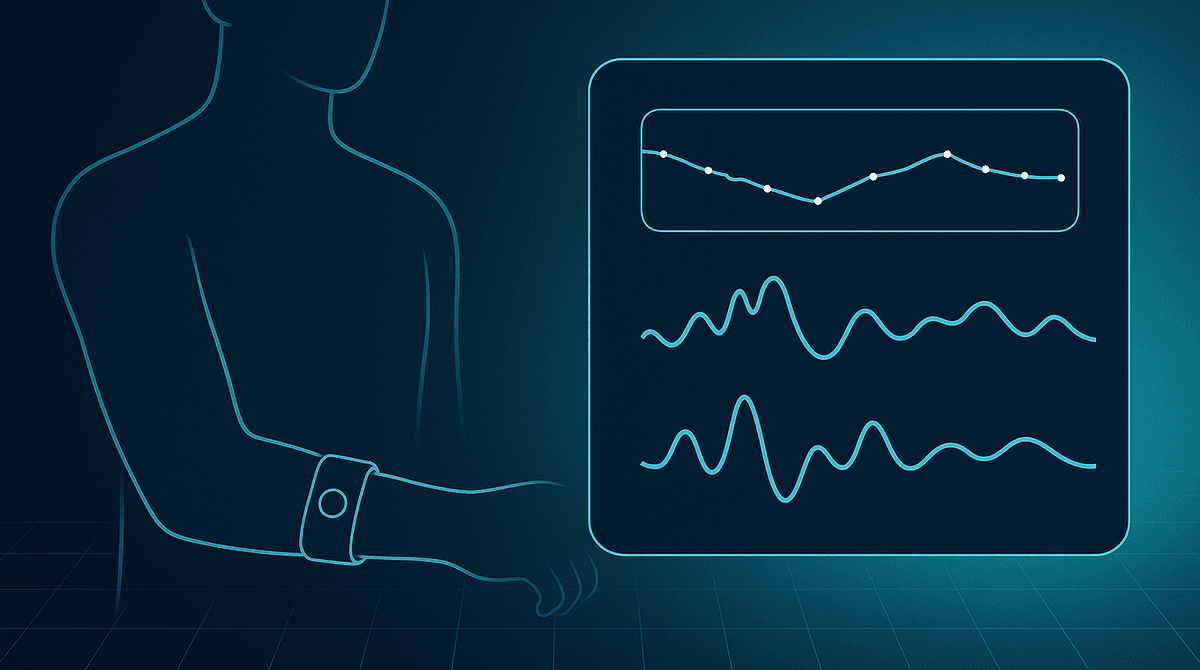
PPG can monitor how the body comes back to baseline after a stress response, and that recovery pattern may be more informative than a single stress score. When heart rate, HRV, and pulse waveform features are tracked together over time, wearables can estimate whether the nervous system is settling quickly, slowly, or unevenly after a stressor.
Many wearable stress features turn a complex physiological state into one number. That can be useful for glanceable feedback, but it can also hide the part that matters most in daily life: what happens next. A person may show a temporary spike during a difficult meeting, a workout, or a poor night of sleep. The more meaningful question is whether the body recovers efficiently afterward.
That is where photoplethysmography, or PPG, becomes interesting. PPG sensors measure changes in blood volume at the skin using light. In watches, rings, and patches, those signals can support heart rate estimation, pulse interval analysis, and waveform analysis. When these features are sampled across the minutes after a stressor, they can help describe a recovery trajectory instead of a single stress label.
If you want background on how consumer devices usually compute stress metrics, see /blog/stress-score-how-it-works. If you want a broader view of what smartwatches can and cannot infer from optical signals, see /blog/can-smartwatch-detect-stress. For a related recovery use case around physical exertion, see /blog/ppg-exercise-recovery-monitoring.
Why recovery may matter more than a stress score
A stress score often tries to summarize autonomic state at one moment. In practice, stress physiology is dynamic. Sympathetic activation can raise heart rate, reduce vagal modulation, and change vascular tone. But those changes do not always happen in a uniform way, and they do not all resolve at the same speed.
Two people can record the same peak stress score and still have very different recovery patterns. One may return to baseline heart rate and variability within a few minutes. Another may keep an elevated pulse, reduced beat to beat variation, and altered peripheral blood flow for much longer. The second pattern may suggest a larger physiological load even if the headline score at the peak looked identical.
Recovery monitoring also fits the way real life works. Many stressors are brief. What affects performance, mood, sleep, and perceived resilience is often the carryover after the event. A wearable that only asks "how stressed are you right now?" misses whether the system is rebalancing well.
What PPG can actually capture during recovery
PPG is often simplified as a heart rate sensor, but the signal contains several layers of information.
1. Heart rate decay
After a mental or emotional stressor, heart rate usually rises and then falls toward baseline. The slope of that decline matters. A fast drop can indicate efficient withdrawal of the acute response. A slow decline can indicate prolonged activation, incomplete recovery, or confounding factors such as movement, heat, caffeine, or ongoing cognitive load.
This is similar in spirit to recovery analysis after exercise, but the context is different. Mental stress recovery can involve smaller signal changes, more behavioral noise, and more overlap with breathing patterns and posture changes. That makes repeated sampling and context awareness important.
2. HRV rebound
Many wearable stress systems use HRV, especially interval variability, as a core input. During stress, short term variability often decreases. During recovery, the useful signal is not only the low point but also the rebound pattern. Does variability recover quickly? Does it overshoot? Does it remain suppressed for twenty minutes? Those patterns may describe autonomic flexibility better than a single number.
Because wrist PPG estimates pulse intervals rather than direct ECG R-R intervals, HRV quality depends on signal quality and artifact handling. Still, when the user is relatively still and the algorithms are conservative, PPG derived HRV can support recovery monitoring well enough for trend tracking.
3. Waveform and vascular features
This is where recovery monitoring gets more interesting. Stress does not only change timing between beats. It can also affect vascular tone and pulse morphology. Depending on the sensor and algorithm, a device may extract features related to pulse amplitude, rising edge, reflection timing, area under the pulse, or beat shape stability.
These waveform features matter because recovery is partly vascular. Even when heart rate has started to settle, peripheral vasoconstriction or altered pulse amplitude may still suggest that the body has not fully returned to its prior state. A model that combines timing and morphology can therefore capture more of the recovery process than a model built on HR alone.
The better model: a recovery trajectory, not a ground truth score
A common product mistake is to treat one stress score as if it were ground truth. That framing is attractive because it is simple, but physiology is messier. There is no single optical marker that defines stress in all users across all situations.
A more defensible approach is to model a trajectory:
- baseline before the event
- acute response during or immediately after the event
- early recovery over the next few minutes
- delayed recovery over the next 10 to 30 minutes
That trajectory can be built from a feature set that includes:
- heart rate level and recovery slope
- short term pulse interval variability measures
- pulse amplitude and amplitude recovery
- beat shape consistency
- motion and posture context
- skin temperature or time of day when available
With this design, the wearable is not claiming to know an absolute stress truth. It is estimating whether recovery is fast, average, slow, or unstable relative to the user's recent baseline and context. That is often more actionable.
Why combining HR, HRV, and waveform features helps
Each feature family has blind spots.
Heart rate responds quickly, but it is nonspecific. Walking upstairs, drinking coffee, getting excited, or thinking hard can all raise it.
HRV is informative, but it is sensitive to breathing, ectopic beats, movement artifacts, and short measurement windows. At the wrist, data quality can vary a lot.
Waveform features may reflect vascular state, but they are affected by sensor contact, skin properties, temperature, and device placement.
When you combine these signals, you reduce the chance that one noisy channel drives the entire interpretation. A practical recovery model might ask:
- Is heart rate still above expected baseline?
- Has pulse interval variability recovered yet?
- Has pulse amplitude normalized?
- Are waveform features stabilizing beat to beat?
- Is the user still moving, talking, or changing posture?
If the answer is "not yet" across several channels, the device has stronger evidence of incomplete recovery than it would from a single score alone.
Real world examples of useful recovery monitoring
After a stressful meeting
Imagine a user sits through a tense thirty minute meeting. During the meeting, motion is low, which is good for signal quality. Heart rate rises modestly, HRV drops, and pulse amplitude falls. The meeting ends, but fifteen minutes later the device still sees elevated heart rate and a slower than usual HRV rebound. That may be more meaningful than the peak score during the meeting itself.
During workday strain accumulation
Recovery monitoring can also reveal stacking effects. A user may recover well from one isolated challenge, but poorly from the third challenge of the day. That pattern can support better coaching around breaks, breathing exercises, hydration, and workload pacing.
Overnight carryover
Even when daytime stress peaks look unremarkable, poor recovery during the evening can spill into sleep onset and overnight autonomic balance. A recovery focused model may therefore connect daytime strain to nighttime recovery more clearly than a momentary score can.
Limits and sources of error
This is the part worth saying plainly: PPG based recovery monitoring is useful, but it is not magic.
First, motion artifact remains a major constraint. Recovery periods in real life are messy. People stand up, walk, talk, type, and shift posture. Any recovery estimate should be downgraded when signal quality is poor.
Second, recovery is context dependent. A slow return after exercise does not mean the same thing as a slow return after an email argument. Devices need activity detection and event context to avoid misleading feedback.
Third, individual baselines matter. The same raw HRV value can mean different things in different users. Personalized baselines are more reliable than one size fits all thresholds.
Fourth, PPG is an indirect signal. It is excellent for scalable wearable monitoring, but it is not a direct measure of sympathetic nerve firing, cortisol, or psychological state. Product claims should stay aligned with what the sensor can support.
What good product design looks like
The best recovery monitoring experience probably will not show a giant stress number all day. It will surface patterns such as:
- "Your pulse and variability returned to baseline quickly after the event"
- "Recovery was slower than your usual pattern this afternoon"
- "Today's late day recovery was weaker than your weekly average"
- "Signal quality was low, so this estimate is uncertain"
That kind of feedback is more honest and more coachable. It also aligns better with the evidence base around wearable physiological monitoring, where trends, multimodal features, and repeated measures usually beat one off labels.
For clinical or higher stakes settings, recovery markers may also be useful because they can be compared over repeated exposures instead of relying on one instantaneous estimate. That makes the signal more suitable for longitudinal monitoring, which is where wearables are strongest.
FAQ
What is stress recovery monitoring with PPG?
Stress recovery monitoring with PPG uses optical pulse signals from a wearable to track how the body returns toward baseline after a stress response. Instead of focusing only on peak stress, it looks at recovery patterns in heart rate, HRV, and pulse waveform features.
Why can recovery be more useful than a stress score?
A stress score is a snapshot. Recovery shows whether the nervous and vascular systems settle efficiently after the event. That can be more relevant for fatigue, resilience, and repeated daily strain.
Can wrist PPG measure HRV well enough for recovery tracking?
Often yes, for trend monitoring during relatively still periods with good signal quality. It is usually less robust than ECG for precise interval analysis, so algorithms should be conservative and quality aware.
What waveform features can matter during recovery?
Depending on device quality, models may use pulse amplitude, beat shape stability, upstroke features, and timing features related to vascular tone. These can add information that heart rate alone misses.
Does a slow recovery always mean something is wrong?
No. Slow recovery can reflect exercise, heat, posture changes, caffeine, illness, poor sleep, or ongoing mental load. Recovery metrics are best interpreted with context and over repeated observations.
Are stress scores useless then?
No. Stress scores can be helpful for quick summaries and user engagement. The problem is treating them as a complete or definitive measure instead of one simplified view of a changing physiological process.
References
- Castaldo R, Melillo P, Izzo R, et al. Wearable systems for stress monitoring from physiological signals. https://pmc.ncbi.nlm.nih.gov/articles/PMC9695300/
- Recent review on PPG based stress and cardiovascular monitoring approaches. https://pmc.ncbi.nlm.nih.gov/articles/PMC11970940/
- Remote and wearable cardiovascular monitoring context. https://doi.org/10.1093/ehjdh/ztab050
Frequently Asked Questions
- What is stress recovery monitoring with PPG?
- Stress recovery monitoring with PPG uses optical pulse signals from a wearable to track how the body returns toward baseline after a stress response. Instead of focusing only on peak stress, it looks at recovery patterns in heart rate, HRV, and pulse waveform features.
- Why can recovery be more useful than a stress score?
- A stress score is a snapshot. Recovery shows whether the nervous and vascular systems settle efficiently after the event. That can be more relevant for fatigue, resilience, and repeated daily strain.
- Can wrist PPG measure HRV well enough for recovery tracking?
- Often yes, for trend monitoring during relatively still periods with good signal quality. It is usually less robust than ECG for precise interval analysis, so algorithms should be conservative and quality aware.
- What waveform features can matter during recovery?
- Depending on device quality, models may use pulse amplitude, beat shape stability, upstroke features, and timing features related to vascular tone. These can add information that heart rate alone misses.
- Does a slow recovery always mean something is wrong?
- No. Slow recovery can reflect exercise, heat, posture changes, caffeine, illness, poor sleep, or ongoing mental load. Recovery metrics are best interpreted with context and over repeated observations.
- Are stress scores useless then?
- No. Stress scores can be helpful for quick summaries and user engagement. The problem is treating them as a complete or definitive measure instead of one simplified view of a changing physiological process.