PPG Heart Rate Measurement: Algorithms, Accuracy, and Practical Implementation
How PPG measures heart rate step by step. Learn peak detection algorithms, beat-to-beat vs averaged HR, and accuracy benchmarks for rest, exercise, and sleep.
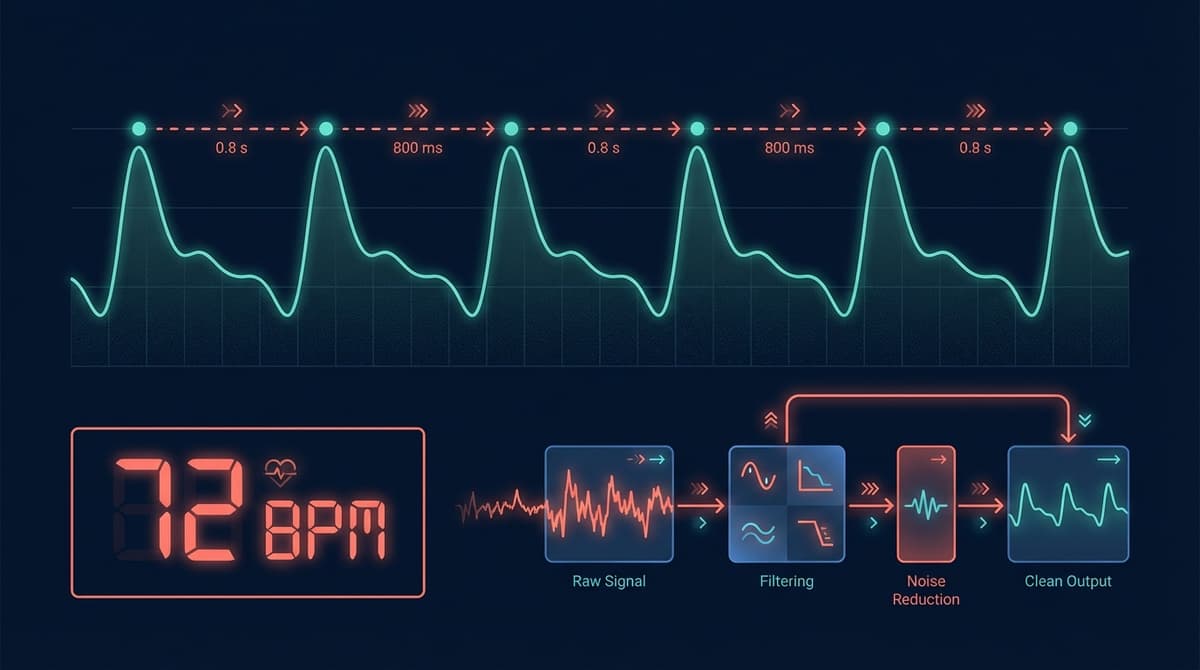
PPG measures heart rate by detecting periodic blood volume changes in tissue using light. An LED shines into the skin, and a photodetector captures intensity variations caused by each cardiac pulse. Heart rate is extracted by identifying individual beats in this optical signal, either through time-domain peak detection, frequency-domain spectral analysis, or autocorrelation methods. Under controlled conditions, modern PPG heart rate algorithms achieve mean absolute errors below 2 BPM compared to ECG reference. This guide walks through the full pipeline from raw signal to heart rate number.
Step 1: Signal Acquisition
Heart rate extraction starts with getting a clean enough signal from the PPG hardware. The analog front end (AFE) drives the LED at a specific current, samples the photodetector output at a fixed rate, and digitizes the result.
Sampling rate matters more than many developers realize. The Nyquist criterion says you need at least 2x the highest frequency of interest. For heart rate up to 240 BPM (4 Hz), you need a minimum of 8 Hz sampling. But for reliable peak detection and HRV analysis, most implementations use 25-100 Hz. Higher rates give better temporal resolution for peak timing but increase power consumption and data volume.
Common sampling rates in consumer devices:
- Apple Watch: 50 Hz (green LED during exercise)
- Oura Ring: 50 Hz (IR LED during sleep)
- Research-grade sensors: 100-256 Hz
- Ultra-low-power sensors: 25 Hz
LED drive current controls signal amplitude. Higher current means more light, a stronger signal, and better SNR, but also more power drain and more heat at the skin surface. Most AFEs support programmable LED current from 0.5 mA to 50 mA or higher. Adaptive LED current control adjusts brightness based on signal amplitude, compensating for different skin types and sensor coupling.
Ambient light rejection removes the DC contribution of sunlight or room lighting. The AFE alternates between LED-on and LED-off samples. Subtracting the LED-off sample from the LED-on sample isolates the light from the LED, removing ambient contamination. This happens at the hardware level in chips like the MAX86150 and AFE4404.
Step 2: Preprocessing and Filtering
The raw digitized PPG signal needs conditioning before any heart rate algorithm can work with it.
DC Removal
The DC component (baseline) of the PPG signal is much larger than the AC pulsatile component, often by 50-100x. Removing or normalizing the DC component is the first step. A simple high-pass filter with a cutoff around 0.3-0.5 Hz removes the baseline drift while preserving the cardiac frequency content. Alternatively, some implementations use a moving average subtraction, where the mean over a sliding window (2-5 seconds) is subtracted from each sample.
Bandpass Filtering
A bandpass filter isolates the frequency range of interest for heart rate. The standard range is 0.5-4.0 Hz, corresponding to 30-240 BPM. This removes:
- Low-frequency drift from respiration (0.1-0.4 Hz), sensor movement, and thermoregulation
- High-frequency noise from 50/60 Hz mains interference, sensor electronics, and quantization
A 4th-order Butterworth bandpass is a common choice. It provides a reasonably flat passband with smooth rolloff. For real-time implementations, IIR filters are preferred over FIR filters because they require fewer coefficients and less computation.
Motion Artifact Reduction
Motion is the biggest source of error in wearable PPG heart rate measurement. When the sensor moves relative to the skin, the optical path changes, creating large signal disturbances that can dwarf the cardiac signal.
Most wearable PPG devices include a 3-axis accelerometer. Motion artifact reduction techniques use accelerometer data to identify and remove motion-correlated components:
Adaptive filtering (NLMS/RLS): The accelerometer signal is used as a reference input. An adaptive filter learns the transfer function between motion and PPG corruption, then subtracts the estimated motion artifact from the PPG signal. Normalized Least Mean Squares (NLMS) is the most common adaptive algorithm due to its simplicity and low computation.
Spectral subtraction: In the frequency domain, peaks in the PPG spectrum that coincide with peaks in the accelerometer spectrum are identified as motion artifacts and removed or attenuated.
Signal decomposition (ICA, EMD): Independent Component Analysis or Empirical Mode Decomposition separates the PPG signal into components. Components correlated with accelerometer data are classified as motion and discarded.
For a deeper look at Kalman filtering approaches, see our PPG Kalman filter heart rate guide.
Step 3: Heart Rate Extraction Algorithms
With a cleaned PPG signal, the next step is extracting heart rate. There are several algorithmic families, each with distinct strengths.
Time-Domain Peak Detection
The most intuitive approach: find the peaks in the PPG waveform and count them. Each peak corresponds to one heartbeat.
Basic peak detection uses a threshold crossing or local maximum search. The algorithm scans the filtered signal for points higher than their neighbors and above a minimum amplitude threshold. The time between consecutive peaks gives the instantaneous pulse-pulse interval (PPI), and heart rate is calculated as 60 / PPI.
Adaptive threshold methods adjust the detection threshold based on recent signal amplitude. This handles the fact that PPG amplitude varies with perfusion, sensor contact, and activity level. A common approach sets the threshold at 40-60% of the recent peak amplitude, updated every few seconds.
Pan-Tompkins adapted for PPG: The Pan-Tompkins algorithm was originally designed for ECG R-peak detection. Adapted versions for PPG apply a similar pipeline: bandpass filter, derivative, squaring, and integration, followed by adaptive thresholding with refractory period enforcement. The squaring step emphasizes the steep upstroke of the PPG systolic peak, making it more distinct. The refractory period prevents double-counting by ignoring detections within a physiologically impossible interval (typically 200-300 ms after the last detected peak, corresponding to a maximum heart rate of 200-300 BPM).
Template matching uses a reference pulse shape (template) derived from recent clean beats. The algorithm slides the template across the signal and computes a correlation at each position. High correlation peaks indicate heartbeats. This approach is more robust to noise than simple peak detection because it uses the full waveform shape rather than just amplitude.
Frequency-Domain Methods
Instead of finding individual peaks, frequency-domain methods determine heart rate from the dominant frequency in the PPG spectrum.
FFT-based estimation: Apply a Fast Fourier Transform to a windowed segment of the PPG signal (typically 5-10 seconds). The dominant spectral peak in the 0.5-4 Hz range corresponds to the heart rate. Heart rate in BPM equals the peak frequency multiplied by 60.
FFT methods are inherently resistant to random noise because they aggregate energy across many cycles. They struggle with short windows (poor frequency resolution) and with motion artifacts that create spectral peaks near the heart rate frequency.
Welch's method averages multiple overlapping FFT windows to reduce spectral variance. This gives a smoother spectrum and more reliable peak detection at the cost of reduced temporal resolution.
MUSIC and ESPRIT: Subspace spectral estimation methods (Multiple Signal Classification, Estimation of Signal Parameters via Rotational Invariance Techniques) can resolve closely spaced frequencies better than FFT. They are computationally expensive but useful when the heart rate frequency is close to a motion artifact frequency.
Autocorrelation
Autocorrelation measures how similar a signal is to a time-shifted version of itself. A periodic signal will have high autocorrelation at lags equal to the period. For PPG, the first significant autocorrelation peak beyond zero lag corresponds to the pulse period.
Autocorrelation is robust to waveform shape variations and handles moderate noise well. It naturally produces a period estimate (in seconds), which is converted to BPM via 60/period. The downside is that it can lock onto harmonics or subharmonics of the true heart rate, requiring additional logic to resolve ambiguities.
Hybrid Approaches
Modern implementations rarely rely on a single method. Hybrid approaches combine time and frequency domain estimates:
- Run FFT to get a coarse heart rate estimate
- Use the FFT estimate to set the search range for peak detection
- Refine the heart rate using peak-to-peak intervals within that range
- Apply Kalman filtering to smooth the heart rate trajectory and reject outliers
This multi-stage pipeline provides both the noise robustness of spectral methods and the temporal precision of peak detection.
Step 4: Beat-to-Beat vs. Averaged Heart Rate
The distinction between instantaneous and averaged heart rate is important for both accuracy and usability.
Beat-to-Beat (Instantaneous) Heart Rate
Calculated from each individual pulse-pulse interval. If the interval between two consecutive peaks is 0.75 seconds, the instantaneous heart rate is 60 / 0.75 = 80 BPM. This value updates with every heartbeat and reflects rapid changes in heart rate.
Beat-to-beat heart rate is noisy. Physiological heart rate variability means that consecutive intervals naturally differ by 10-50 ms, causing BPM values to fluctuate by 1-5 BPM from beat to beat even under perfect measurement conditions. Add measurement noise from peak detection uncertainty, and individual beat-to-beat values can jump by 5-10+ BPM.
This level of detail is needed for HRV analysis but is not what users see on their watch face.
Averaged Heart Rate
Consumer devices display heart rate averaged over a window, typically 5-15 seconds. Averaging smooths out both physiological HRV and measurement noise, giving a stable, readable number. The window length determines the tradeoff between stability and responsiveness:
- 3-5 seconds: Responsive to rapid changes (intervals, sprints) but more variable
- 10-15 seconds: Stable and smooth, but sluggish during rapid transitions
- 30+ seconds: Very stable, used for resting heart rate metrics
Most exercise-focused devices use adaptive windowing: shorter windows during high-intensity or changing activity, longer windows during steady-state exercise or rest.
Accuracy Across Conditions
Heart rate accuracy from PPG depends heavily on the measurement context. Here is what to expect from well-implemented systems.
At Rest (Seated, Standing)
This is the easiest condition. The sensor is stable, perfusion is adequate, and there are no motion artifacts. Mean absolute error (MAE) is typically 1-2 BPM compared to ECG reference. Limits of agreement (Bland-Altman) are roughly +/- 5 BPM at the 95% level.
During Sleep
Sleep is even easier than seated rest. The body is nearly motionless, and the sensor (whether wrist, ring, or patch) maintains consistent contact. MAE drops below 1 BPM for many devices. Sleep is where PPG heart rate is most trustworthy and where long-term trends are most meaningful.
During Walking and Light Exercise
Moderate, rhythmic motion creates periodic artifacts in the PPG signal. Modern motion compensation algorithms handle this well. MAE ranges from 2-5 BPM. Errors tend to be transient, occurring during gait transitions or arm swing pattern changes.
During Running and Vigorous Exercise
This is where PPG struggles most. Wrist-based sensors experience large, rapid motion artifacts from arm swing. The heart rate itself is higher, meaning less time between beats for peak detection. Sweat can degrade optical coupling.
MAE during running ranges from 3-10 BPM depending on the device, intensity, and terrain. Flat treadmill running produces less motion variability than trail running. Several benchmark studies document these accuracy ranges, including Gillinov et al. (2017) published in the Annals of Internal Medicine.
During Strength Training
Gripping weights creates venous pooling and large pressure changes in the wrist that can distort the PPG waveform. Isometric exercises cause blood pressure spikes that change pulse wave characteristics. Wrist-based PPG accuracy during resistance training is often worse than during running, with MAE of 5-15 BPM in some studies.
For detailed accuracy analysis across conditions and devices, see our PPG heart rate accuracy benchmark.
Signal Quality Assessment
Before trusting a heart rate estimate, the system should assess whether the underlying signal is good enough to produce a reliable result. Signal quality assessment (SQA) determines when to report a number and when to suppress output.
Common signal quality metrics include:
Perfusion index: The AC/DC ratio of the PPG signal. Values above 0.5-1.0% generally indicate adequate signal. Below that, the pulsatile component may be too weak for reliable beat detection.
Skewness: Clean PPG waveforms have a characteristic asymmetric shape (steep upstroke, gradual downstroke). Heavily corrupted signals lose this asymmetry. Skewness values in the expected range indicate clean signals.
Template correlation: Correlating the current signal segment with a template derived from recent clean beats. High correlation (r > 0.8) suggests the signal is clean. Low correlation suggests motion corruption or sensor liftoff.
Spectral quality: A clean PPG should have a dominant spectral peak with harmonics. If the spectrum lacks a clear dominant peak or has energy spread broadly, the signal is too noisy for reliable heart rate extraction.
For more on signal quality metrics and thresholds, see our PPG signal quality assessment guide.
Practical Implementation Tips for Researchers and Developers
Choosing a Sampling Rate
For heart rate only, 25-50 Hz is sufficient. For HRV analysis, use at least 50 Hz and preferably 100 Hz. If you are also extracting waveform features (pulse wave velocity, augmentation index), go to 100-256 Hz. Higher is not always better because it increases power consumption and storage requirements without improving heart rate accuracy.
Handling Edge Cases
Ectopic beats: Premature ventricular contractions (PVCs) and premature atrial contractions (PACs) produce abnormal pulse intervals. A single PVC creates one short interval followed by one long interval, which can cause a spike and dip in instantaneous heart rate. Robust algorithms flag ectopic beats and interpolate the surrounding intervals.
Sensor liftoff: When the sensor loses contact with the skin, the signal drops to zero or saturates. Detecting liftoff events and suppressing heart rate output during those periods is important for data quality.
Low perfusion: Cold fingers, Raynaud's phenomenon, or peripheral vascular disease can reduce PPG signal amplitude to near-zero. Adaptive LED current can help, but at some point, the signal is genuinely too weak for reliable measurement. The system should detect this and communicate it rather than reporting inaccurate values.
Deep Learning Approaches
Neural networks for PPG heart rate estimation have shown strong results, particularly during motion. Models based on 1D convolutional networks or LSTM architectures can learn to extract heart rate from noisy PPG+accelerometer data without explicit motion cancellation steps.
The PPGNet and CorNET architectures, among others, have demonstrated improvements over classical methods during exercise, with MAE reductions of 1-3 BPM compared to traditional adaptive filtering. The tradeoff is computational cost and the need for large, labeled training datasets. For more on deep learning PPG processing, see our deep learning heart rate estimation guide.
Validation Against Reference
Any heart rate algorithm should be validated against ECG reference using standard statistical methods:
- Mean absolute error (MAE): Average absolute difference between PPG and ECG heart rate
- Bland-Altman analysis: Plots the difference between methods against their average, revealing systematic bias and limits of agreement
- Correlation coefficient: Pearson r between PPG and ECG heart rate time series
- Coverage: Percentage of time the algorithm produces a heart rate estimate (vs. suppressing output due to poor signal quality)
The IEEE 1708 standard defines validation protocols for wearable heart rate monitors, specifying activities, populations, and statistical criteria. Following this standard ensures comparability with published device validations.
Frequently Asked Questions
How does PPG calculate heart rate from light signals?
PPG shines light into the skin and detects how much is absorbed or reflected. Blood volume in capillaries increases with each heartbeat, absorbing more light. The photodetector sees this as a periodic dip in received light intensity. Heart rate is calculated by measuring the time between these dips (peak detection) or by finding the dominant frequency of the periodic signal (spectral analysis).
What is the best algorithm for PPG heart rate detection?
There is no single best algorithm. For stationary conditions, simple peak detection with adaptive thresholding works well and is computationally cheap. For exercise and motion scenarios, hybrid approaches combining spectral estimation with accelerometer-based motion cancellation perform best. Deep learning methods show the strongest results during heavy motion but require more processing power. The right choice depends on your accuracy requirements, power budget, and target use case.
How accurate is PPG heart rate compared to ECG?
At rest, PPG heart rate matches ECG within 1-2 BPM on average. During walking, expect 2-4 BPM error. During running, 3-8 BPM depending on device quality and exercise intensity. During sleep, errors often drop below 1 BPM. These numbers represent well-designed systems with motion compensation. Budget devices without accelerometer fusion will show larger errors.
Why does my smartwatch show wrong heart rate during exercise?
The most common cause is motion artifacts. Wrist movement during exercise corrupts the PPG signal, and the algorithm may track a motion frequency instead of the cardiac frequency. Poor fit (watch too loose) and sweat (reducing optical coupling) make it worse. Tightening the band, wearing the watch higher on the wrist (away from the wrist bone), and avoiding activities with extreme wrist motion can help.
What sampling rate do I need for PPG heart rate measurement?
For basic heart rate (BPM), 25 Hz is sufficient. For heart rate variability (HRV) analysis with clinically meaningful temporal resolution, use at least 50 Hz and ideally 100 Hz. Higher sampling rates above 100 Hz provide diminishing returns for heart rate but may be useful if you are also extracting pulse wave features.
Can PPG measure heart rate during swimming?
Water changes the optical properties of the skin-sensor interface and can create air gaps as the wrist rotates through water. Most wearables report heart rate during swimming, but accuracy is reduced compared to land-based exercise. Devices with strong sensor-skin coupling (tight band, good seal) perform better. Some devices only report post-swim averaged heart rate rather than real-time tracking.
What is the difference between beat-to-beat and averaged heart rate?
Beat-to-beat heart rate is calculated from each pair of consecutive pulses and updates with every heartbeat. It is noisy and fluctuates due to both physiological variability and measurement uncertainty. Averaged heart rate smooths values over a time window (typically 5-15 seconds), giving a stable number for display. Averaged HR is what you see on a watch face; beat-to-beat intervals are what HRV algorithms analyze.