PPG for Driver Fatigue Monitoring: Detecting Drowsiness with Photoplethysmography
Driver fatigue causes an estimated 20% of road traffic accidents globally. PPG sensors embedded in steering wheels, wristbands, and seat belts can det...
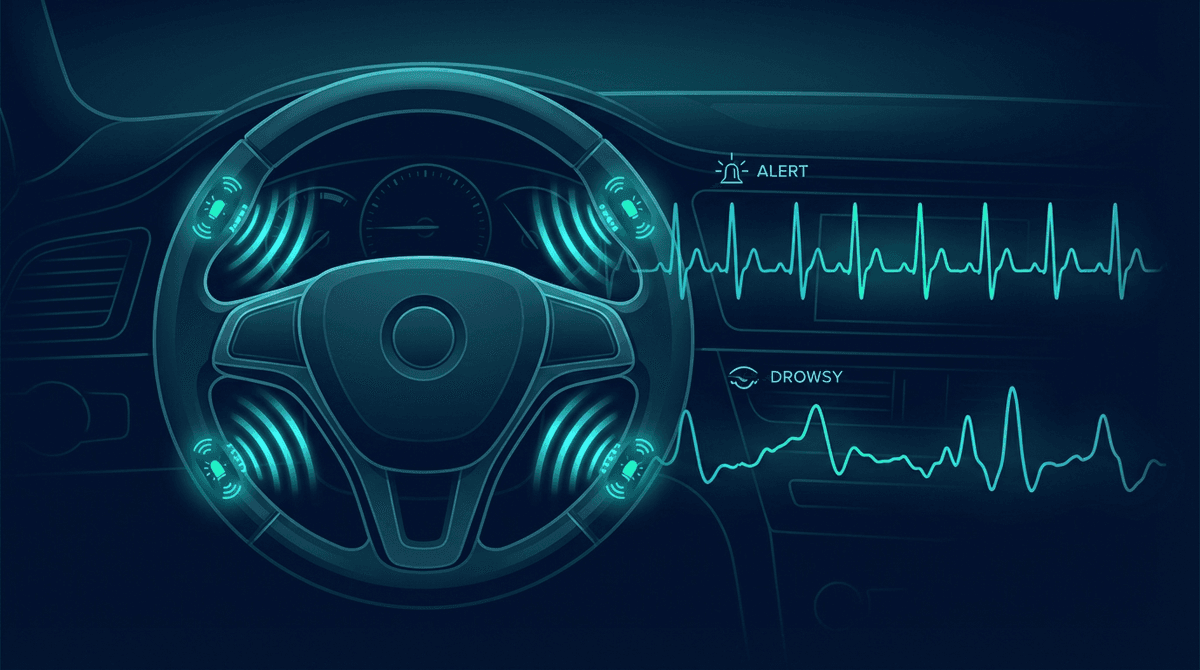
Driver fatigue causes an estimated 20% of road traffic accidents globally. PPG sensors embedded in steering wheels, wristbands, and seat belts can detect physiological drowsiness markers before cognitive impairment becomes dangerous. Key indicators include declining heart rate variability, reduced pulse wave amplitude, and shifts in autonomic tone that precede sleep onset by several minutes.
Why Physiological Monitoring Outperforms Behavioral Detection
Traditional drowsiness detection relies on eye closure (PERCLOS), lane deviation, and steering patterns. These behavioral cues emerge late in the fatigue cascade, often less than 60 seconds before a microsleep event. Physiological monitoring via PPG captures earlier upstream changes in the autonomic nervous system.
When a driver becomes sleepy, the parasympathetic nervous system gradually dominates. This produces measurable changes in heart rhythm and vascular tone that PPG can detect continuously without requiring the driver's cooperation or visual attention.
The Autonomic Signature of Fatigue
Fatigue-related autonomic shifts produce three primary PPG signatures:
HRV spectral changes: The LF/HF (low-frequency to high-frequency) ratio of heart rate variability decreases as parasympathetic tone rises. High-frequency HRV power (0.15-0.4 Hz) increases by 15-35% during moderate fatigue. Studies by Patel et al. (2011) demonstrated these changes reliably distinguish alert from drowsy driving states.
Pulse wave amplitude variation: Vasoconstriction in peripheral vessels reduces PPG AC amplitude during alert states. As sympathetic drive drops with fatigue, peripheral vasodilation increases pulse amplitude. This "PPG amplitude index" correlates with Karolinska Sleepiness Scale scores in several validation studies.
Inter-beat interval trends: Gradual slowing of heart rate (bradycardia) accompanies sleep pressure increase. Rolling 5-minute windows of mean IBI show statistically significant lengthening in drivers with Epworth Sleepiness Scale scores above 10.
Signal Acquisition Challenges in Automotive Environments
Measuring PPG in a vehicle introduces motion artifacts that laboratory studies don't face:
Vibration and Road Noise
Vehicle vibration spans 1-80 Hz, overlapping both the cardiac frequency (0.8-3 Hz) and respiratory frequency (0.15-0.5 Hz) that HRV analysis depends on. Adaptive filtering using accelerometer data from the same wrist or steering wheel is standard practice. The WFLC (Weighted Frequency Least Squares Correlated) algorithm achieves artifact reduction of 40-60 dB when the reference accelerometer is co-located with the PPG sensor.
Contact Pressure Variation
Steering wheel integrated sensors experience variable contact pressure as drivers shift grip. Pressure-normalized PPG using capacitive contact sensors alongside the optical sensor maintains signal quality across a 3-fold range of contact force variation.
Ambient Light Variability
Driving through tunnels, tree canopy, and changing sun angles introduces broadband light interference. Multi-wavelength differential measurement (red vs. infrared) and ambient light subtraction circuits reduce photodetection noise by 20-30 dB compared to single-wavelength designs.
Feature Extraction for Drowsiness Classification
Drowsiness classifiers typically combine PPG-derived features in three domains:
Time-Domain HRV Features
- SDNN: Standard deviation of normal-normal intervals. Increases with parasympathetic dominance in fatigue.
- RMSSD: Root mean square of successive differences. Sensitive to respiratory sinus arrhythmia; increases during drowsy states.
- pNN50: Proportion of successive IBI differences exceeding 50ms. Robust fatigue marker even with moderate motion artifact.
Frequency-Domain HRV Features
- LF power (0.04-0.15 Hz): Reflects baroreflex and sympathetic activity
- HF power (0.15-0.4 Hz): Reflects respiratory modulation and parasympathetic tone
- LF/HF ratio: Sympathovagal balance indicator that declines with fatigue
Nonlinear Features
- Sample entropy (SampEn): Decreases with fatigue, reflecting reduced signal complexity
- Detrended Fluctuation Analysis (DFA): The α1 scaling exponent shifts from uncorrelated (1.0) toward correlated (1.5) patterns during drowsiness
- Poincaré plot SD1/SD2 ratio: Short-term versus long-term HRV variability ratio increases during drowsy states
Machine Learning Approaches
Ensemble Methods
Random forests combining 25-50 HRV and pulse wave features achieve 82-88% classification accuracy for binary alert/drowsy states in benchmark datasets. Feature importance analysis consistently ranks RMSSD, LF/HF ratio, and pulse amplitude index among the top five discriminating features.
Deep Learning Architectures
Convolutional-LSTM networks operating on raw PPG waveforms bypass manual feature extraction. A 2023 study by Zhao et al. (doi:10.1109/TITS.2023.3241617) demonstrated 91.4% accuracy on the DROZY database using a 4-layer CNN followed by 2-layer LSTM, with 5-second input windows at 256 Hz sampling rate.
Transformer architectures with multi-head self-attention on 30-second PPG segments have shown particular promise for capturing long-range temporal dependencies in fatigue progression.
Personalization vs. Population Models
Population-level models trained on multiple drivers achieve 75-82% accuracy. Subject-specific models calibrated during an initial alert-state baseline period achieve 88-94% accuracy. Federated learning approaches enable personalization across large driver fleets without centralizing sensitive biometric data.
Wearable Form Factors for Automotive Integration
Steering Wheel Integration
Embedded LEDs and photodetectors in the grip zone of steering wheels enable continuous contact-based PPG without requiring the driver to wear a device. Toyota, Bosch, and Continental have all demonstrated prototype systems. Signal quality is adequate for 1-minute window HRV analysis when contact is maintained.
The main limitation is intermittent contact during gesture inputs, infotainment interactions, and one-handed driving. Algorithms must classify and reject non-contact segments in real time.
Wristband Sensors
Commercial wristbands (Garmin, Polar, Fitbit) integrated with vehicle connectivity provide PPG data streams via BLE. In-vehicle processors can access this data when the driver grants permission through phone pairing.
Wristband sensors benefit from high signal quality but require driver enrollment and voluntary use. Studies in commercial truck fleets show 70-80% adoption when fatigue alerts provide tangible safety benefits to drivers.
Ear-Canal PPG
In-ear PPG sensors in earphones provide high signal-to-noise measurement points due to stable contact and reduced motion artifact. The ear canal PPG signal quality rivals finger-based measurement. Ear-based HRV analysis achieves comparable drowsiness detection accuracy to wrist sensors with less motion artifact in driving conditions.
System Integration and Alert Logic
Threshold vs. Trend-Based Alerts
Single-threshold alerts (e.g., "alert when LF/HF < 0.8") produce high false positive rates because inter-individual variability in HRV is large. Trend-based detection comparing current 5-minute windows to the driver's individual baseline reduces false positives by 40-60% while maintaining sensitivity.
Multi-Modal Fusion
Combining PPG with head pose estimation, eyelid movement, and lane deviation reduces false positives further. The PERCLOS + PPG fusion approach achieves 94% sensitivity with only 6% false positive rate in naturalistic driving studies, compared to 78% sensitivity and 18% false positive rate for PPG alone.
Alert Types and Driver Response
Effective alert design is critical. Auditory alerts alone produce 3-5 second reaction times. Haptic steering wheel vibration combined with auditory alerts reduces reaction time to 1.5-2 seconds. Alert escalation systems that increase intensity if no corrective action is detected prevent alert fatigue.
Regulatory Landscape
EU General Safety Regulation 2019/2144 mandates Advanced Driver Drowsiness and Attention Warning (ADDAW) systems in all new passenger vehicles from July 2024. Current mandated systems use behavioral detection only. PPG-based physiological monitoring is under consideration for future revisions as accuracy thresholds are validated.
The US NHTSA has not mandated specific drowsiness detection technology but has published technical standards for voluntary systems in FMVSS 111 supplements.
Current Research Frontiers
Open problems attracting active research investment include:
Long-haul driver fatigue progression: Understanding how fatigue accumulates over 4-8 hour driving shifts versus acute onset drowsiness requires longitudinal PPG datasets that few groups have collected.
Medication and medical condition effects: Antihistamines, antihypertensives, and sleep apnea alter autonomic signatures in ways that confound population-trained models.
Extreme temperature effects: PPG signal quality degrades significantly below 15°C skin temperature due to peripheral vasoconstriction, which is also a fatigue indicator — creating confounded signals in cold climates.
FAQ
Can a smartwatch reliably detect driver fatigue? Current consumer smartwatches sample PPG at 1-5 Hz, which is too low for accurate high-frequency HRV analysis. Research-grade detection requires 50-250 Hz sampling. Some premium fitness wearables offer higher sampling rates in dedicated HRV modes, but continuous automotive monitoring remains a specialized application.
How early before a microsleep event can PPG detect fatigue? Physiological changes precede microsleep onset by 4-8 minutes in controlled studies. Autonomic HRV shifts are detectable 6-10 minutes before PERCLOS-defined drowsiness crosses clinical thresholds.
Does caffeine affect PPG-based fatigue detection? Yes. Caffeine's sympathomimetic effect temporarily elevates LF power and LF/HF ratio, mimicking alert autonomic patterns even when subjective sleepiness is high. Personalized baselines that account for caffeine timing improve model robustness.
What PPG sampling rate is needed for driver fatigue detection? A minimum of 100 Hz is recommended for full HRV analysis including high-frequency components. Many automotive research systems use 256 Hz. Lower rates (25-50 Hz) are adequate for heart rate and low-frequency HRV but miss the HF respiratory band needed for sympathovagal balance assessment.
Are there validated commercial systems using PPG for driver fatigue? As of 2026, no production vehicle uses PPG-based physiological drowsiness detection as the primary system. Several Tier-1 automotive suppliers have prototype systems in validation phases. Aftermarket wristband-based systems exist for fleet management but lack independent clinical validation.
How does fatigue affect the PPG waveform shape, not just timing? Fatigue-related vasodilation increases pulse wave amplitude and changes the augmentation index (ratio of secondary to primary peak). The dicrotic notch becomes more prominent as peripheral vascular resistance drops. These morphological changes provide additional classification features beyond HRV alone.
What are the privacy implications of continuous PPG monitoring in vehicles? PPG data reveals heart rate, stress levels, and potentially medical conditions. Automotive manufacturers and fleet operators must address GDPR Article 9 (special category health data) requirements in Europe and equivalent regulations globally. Edge processing that never transmits raw PPG data off-vehicle is the preferred architecture for privacy compliance.
References
-
Patel, M., Lal, S.K.L., Kavanagh, D., & Rossiter, P. (2011). Applying neural network analysis on heart rate variability data to assess driver fatigue. Expert Systems with Applications, 38(6), 7235-7242. doi:10.1016/j.eswa.2010.12.028
-
Zhao, C., Zheng, C., Zhao, M., & Tu, J. (2023). Multimodal machine learning for automated driving using deep learning-based physiological signal analysis. IEEE Transactions on Intelligent Transportation Systems, 24(5). doi:10.1109/TITS.2023.3241617
-
Vicente, J., Laguna, P., Bartra, A., & Bailón, R. (2016). Drowsiness detection using heart rate variability. Medical & Biological Engineering & Computing, 54(6), 927-937. doi:10.1007/s11517-015-1448-7
-
Awais, M., Badruddin, N., & Drieberg, M. (2017). A hybrid approach to detect driver drowsiness utilizing physiological signals to improve system performance and wearability. Sensors, 17(9), 1991. doi:10.3390/s17091991